Indicator Range Detector — one-click range and breakout detection
Introduction
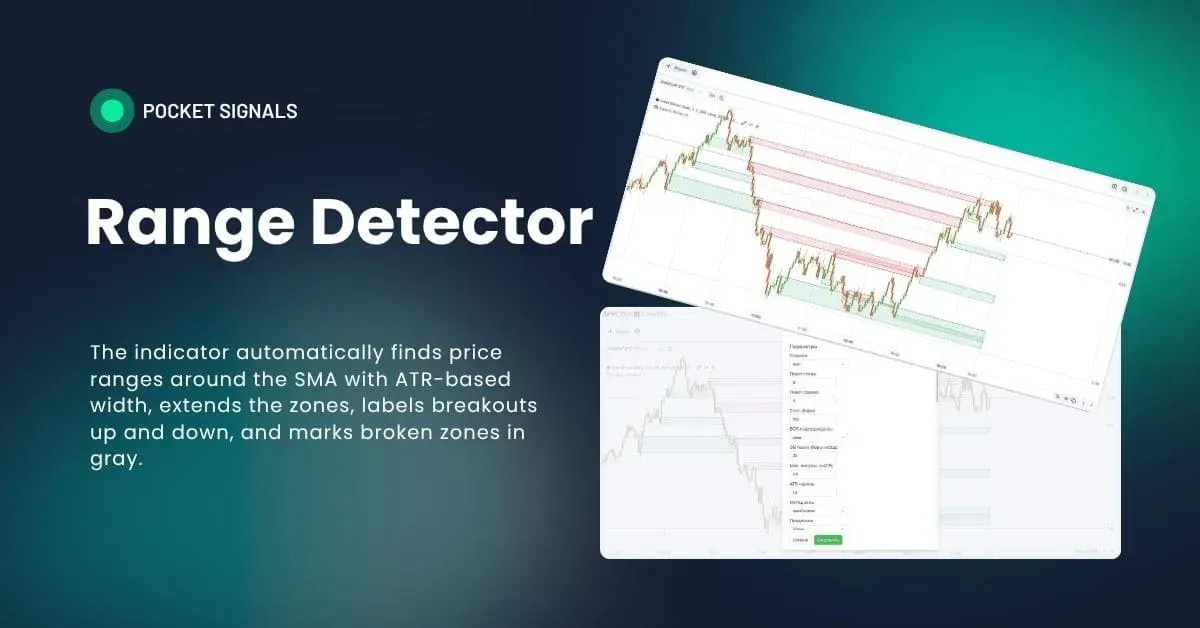
Range Detector is a simple, intuitive indicator for finding sideways ranges — sections where price churns around a moving average without a clear trend. The indicator draws rectangle range zones, extends them to the right, and marks where a breakout happened — up or down.
If you trade binary options on Pocket Option in Spectra Charts, knowing where the market has been ranging helps you avoid false impulses and choose more careful breakout-retest strategies. In PoSignals materials we use Range Detector as a background filter and as a learning tool for beginners.
What a range is and how we capture it
- SMA — simple moving average. It’s the average close over the last N bars. The larger the window, the “calmer” the line.
- ATR — average true range. A volatility gauge showing how much price moves on average.
- In this indicator, a range is a “corridor” around the SMA with half-width ATR × multiplier. If a minimum of bars in a row closed inside this corridor, the market was effectively sideways.
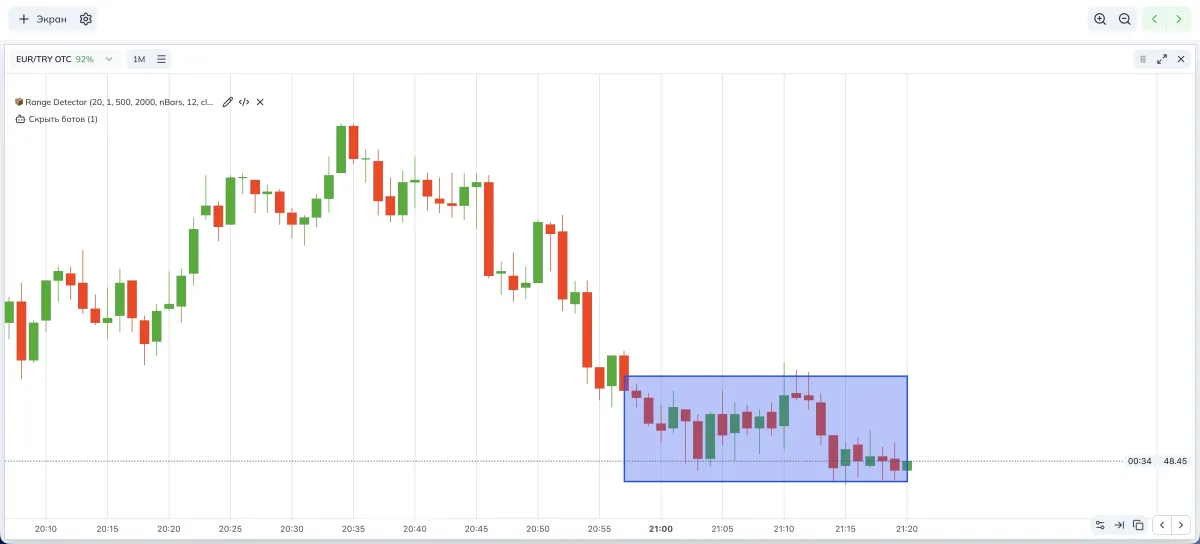
The indicator checks a window of the specified number of bars; if all closes in it fit the corridor around the SMA, it forms a range zone. The zone is extended to the right and changes color when a breakout occurs under your rules.
How Range Detector works step by step
- Computes SMA with the length “Minimum bars” and ATR with the length “ATR period”.
- Builds a permitted deviation band above/below the SMA with width ATR × multiplier.
- Verifies that Minimum bars in a row closed inside this band. If yes — that’s a range.
- Draws a rectangle from the first to the last bar of the window. If windows touch, the indicator glues them into one long zone.
- Extends the zone to the right via the “Extension” setting — to the current bar or for N bars.
- Watches for a breakout. If price breaks up — a “breakout up” label; if down — “breakout down”. In the extension you can keep broken zones in gray.
Indicator parameters (visual)
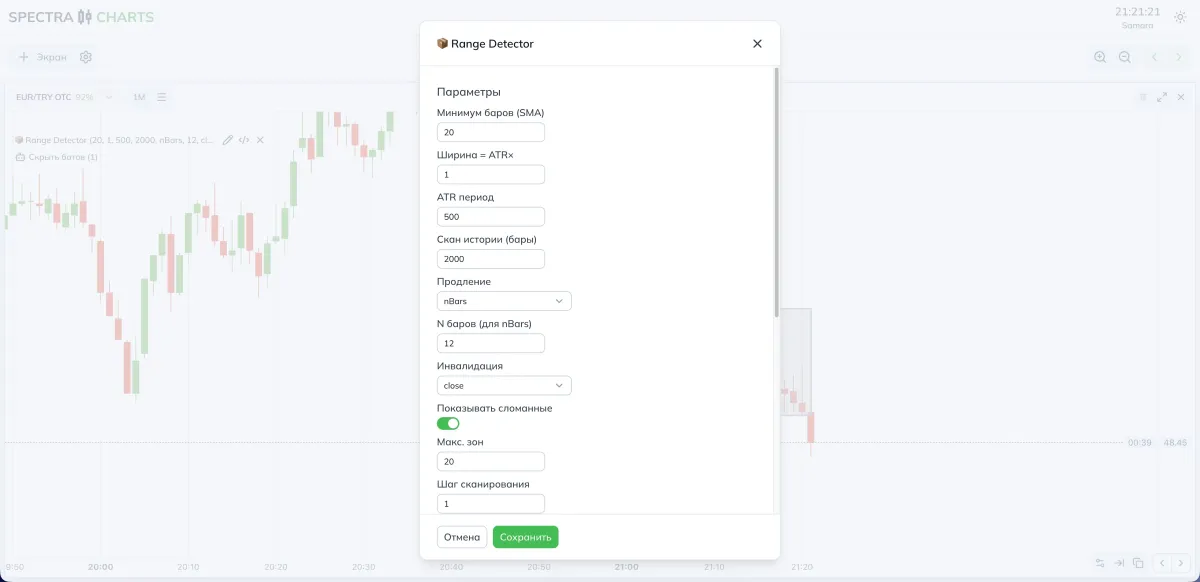
Parameters and their impact on signals
Below are all settings as you see them in the interface. The right columns hint what changes if you go lower or higher.
Range logic
| Parameter | What it does | If you decrease | If you increase |
|---|---|---|---|
| Minimum bars (SMA) | Length of the window and SMA to verify a range | More ranges, more sensitive | Fewer ranges, more reliable |
| Width = ATR× | Half-width of the SMA corridor | Narrow corridor, more false breaks | Wider corridor, absorbs noise |
| ATR period | ATR length (measures volatility) | Reacts faster, more noise | Smoother, more robust to noise |
| Scan history (bars) | How many bars back to search | Fewer zones, faster | More zones, deeper history |
Extension and breakouts
| Parameter | What it does | If you decrease | If you increase |
|---|---|---|---|
| Extension | How to extend to the right: none, to now, or N bars | Short tails | Area stays visible longer |
| N bars (for nBars) | Tail length in nBars mode | Short relevance | On screen longer |
| Invalidation | How to count the breakout: by wick or by close | You see breaks earlier | Breakouts rarer, more confident |
| Show broken | Keep the zone gray after breakout in extension | Cleaner chart, less context | Useful to see old frames for retests |
Limiters and accelerators
| Parameter | What it does | If you decrease | If you increase |
|---|---|---|---|
| Max zones | Cap on rectangles on screen | More detail | Cleaner and faster |
| Scan step | Check every N-th bar | More precise, but slower | Faster, may miss short windows |
| Anti-duplicates (skip bars) | Pause after fixing a zone to avoid neighbors | More similar zones | Smoother zone flow |
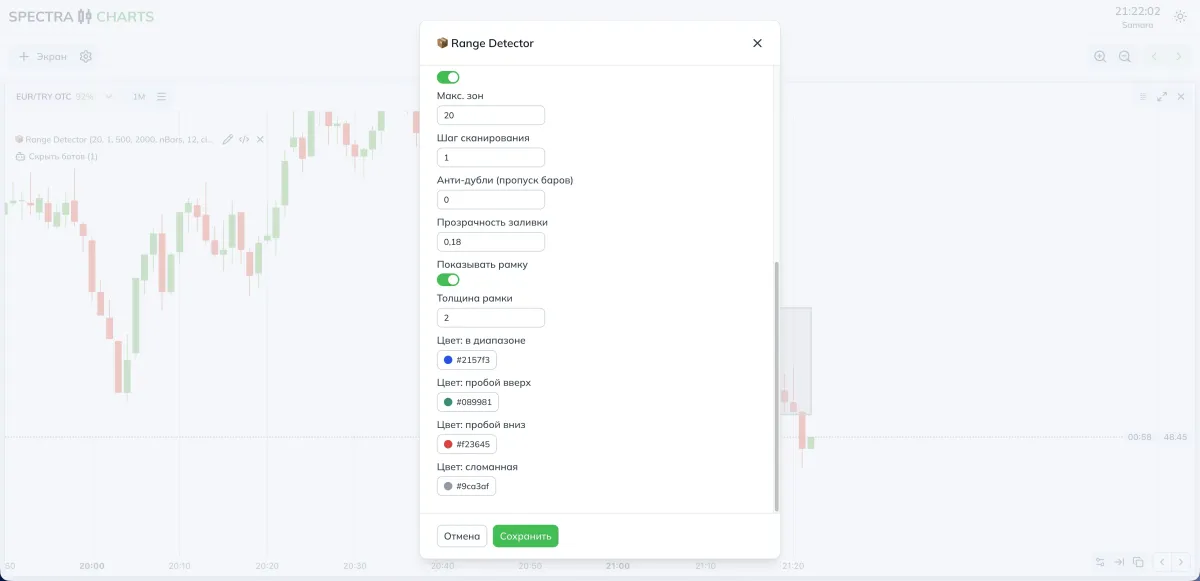
Fill visuals
| Parameter | What it does | If you decrease | If you increase |
|---|---|---|---|
| Fill opacity | Rectangle brightness | Subtle | Brighter and more visible |
| Show border | Zone outline | Minimalism | Boundaries read better |
| Border thickness | Outline thickness | Light outline | Emphasis on the level |
Status colors
| Parameter | Meaning |
|---|---|
| Color: in range | Zone not broken yet |
| Color: breakout up | Zone broken upward by the chosen rule |
| Color: breakout down | Zone broken downward |
| Color: broken | In extension, mark the zone as no longer a valid range |
How to get more signals or make them stricter
- More signals
- Reduce Minimum bars,
- Slightly lower the ATR period,
- Narrow Scan step to 1,
- Raise Width = ATR× to 1.2–1.5 so ranges are detected more often and live longer.
- Fewer but cleaner
- Increase Minimum bars,
- Lengthen the ATR period,
- Keep Width = ATR× around 0.8–1.0,
- Count breakout by close,
- Limit Max zones and keep only the freshest ones.
Combination ideas with other filters
- With trend context. If you have a context card or a trend assessment, trade range breakouts with the context and skip breakouts against the trend.
- With OB or liquidity. A range breakout that aligns with a supply/demand zone often gives a cleaner retest.
- With inner timeframes. On a lower TF, the range zone can be a precise entry inside a larger structure.
Practical presets
- Minimum bars (SMA) — 12–20
- Width = ATR× — 1.0–1.4
- ATR period — 200–400
- Scan history (bars) — 2000
- Extension — nBars
- N bars (for nBars) — 8–20
- Invalidation — by close
- Show broken — on, to see old frames for retests
- Scan step — 1
- Anti-duplicates (skip bars) — 0–3
- Minimum bars (SMA) — 20–40
- Width = ATR× — 0.8–1.2
- ATR period — 400–800
- Scan history (bars) — 5000–10000
- Extension — nBars
- N bars (for nBars) — 30–120
- Invalidation — by close (stricter breakouts)
- Show broken — optional, if you want level context
- Scan step — 1–2
- Anti-duplicates (skip bars) — 3–7
Step-by-step strategy for binary options
Identify a range
Wait for a fresh range zone to appear. Make sure the backdrop is calm and there’s no sharp news. In Spectra Charts the zone is already marked by a rectangle.
Wait for the breakout
Choose your breakout rule in advance — by wick or by close. For beginners we recommend by close to reduce false signals.
Trade the retest
After an upside breakout, wait for a return to the upper boundary or slightly above. For a downside breakout — a return to the lower boundary or slightly below. Plan the entry on the next candle after a confirmed touch.
Expiration
For OTC start with one candle; on calm stretches two are acceptable. On the real market it’s usually two candles if volatility is low and the breakout is “clean”.
Risk
One fixed stake per signal. If there was no retest or the breakout failed, skip the scenario. Don’t average entries inside the same zone.
FAQ
Width is set by Width = ATR× and the ATR period. The higher the multiplier and period, the more robust the zone is to noise and the rarer the breakouts; lower values make the corridor narrower and more sensitive.
Reduce Scan history (bars), lower Max zones, increase Minimum bars (SMA) and Scan step so the chart becomes lighter and faster.
Count Invalidation by close rather than wick. Increase Minimum bars (SMA) so the range itself is higher quality.
Turn Show broken off or shorten the tail by reducing N bars in Extension = nBars mode.
Conclusion
Range Detector is easy to set up and well suited for learning and early practice in strategies on Pocket Option. It shows where the market was in a range, where a breakout happened, and gives convenient points to work the retest. Configure ATR-based width, SMA window length, and zone extension, then apply entry discipline, trading only where the picture is truly clear.