Indicator Order Blocks — automatic supply and demand zones
Introduction
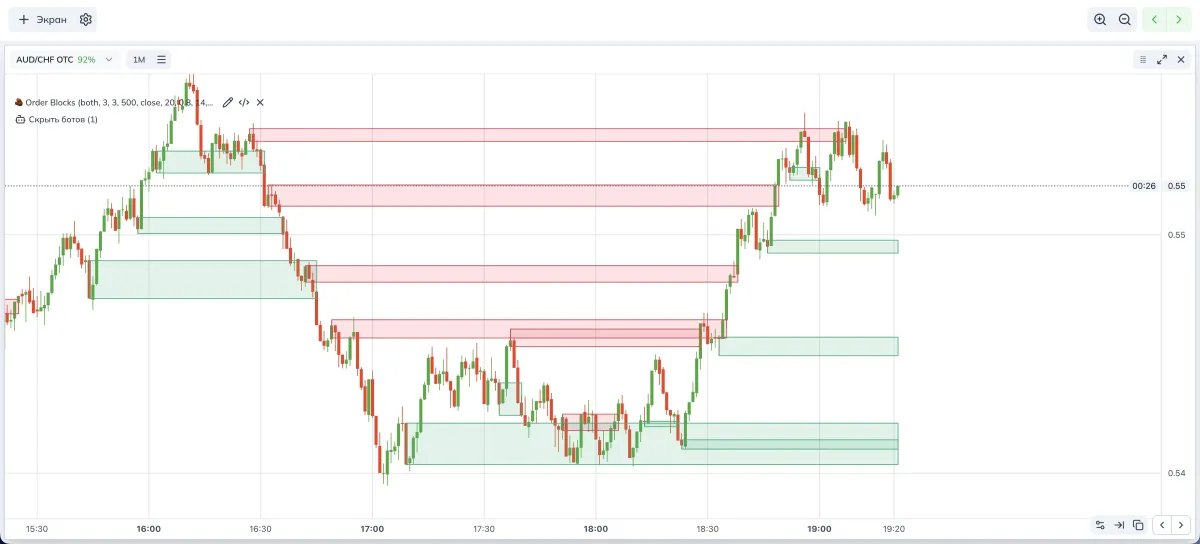
Order Blocks is an indicator that looks for the source candle before a break of structure and builds a demand or supply zone from it. Then it watches what happens to the zone — whether there was a retest or a break — and neatly extends the rectangle to the right.
If you trade binary options on Pocket Option via Spectra Charts, such zones help you see where price often pulls back and provide a clear scenario for a trade. At PoSignals we use this logic as a base for education and simple strategies.
Before we start, here are brief definitions to make it comfortable for beginners.
- Swing — a local high or low; a visible peak or trough on the chart.
- BOS, Break of Structure — a break of the last significant swing. For growth this is a move above the last swing high; for decline — below the swing low.
- Order Block, OB — the last opposite candle before the BOS. We build the zone from it.
- Mitigation — a retest of the zone when price touches the source area.
- Invalidation — a break of the zone; price moves beyond the area so the zone loses strength.
How the indicator works — in simple terms
- Finds swings using the “Pivot left” and “Pivot right” settings.
- Tracks BOS by the selected criterion — by candle close or by wick.
- Back in time searches for the OB candle, the last opposite one before the break.
- Builds a zone by the chosen method — by body, by wick, or from open to extreme.
- Extends the zone to the right to current price or for a given number of bars.
- Monitors events. If there was a retest, that’s mitigation. If the zone is broken against us, that’s invalidation.
- Cleans noise. Limits the number of zones, can merge nearby areas, and avoids duplicates.
Indicator parameters (visual)
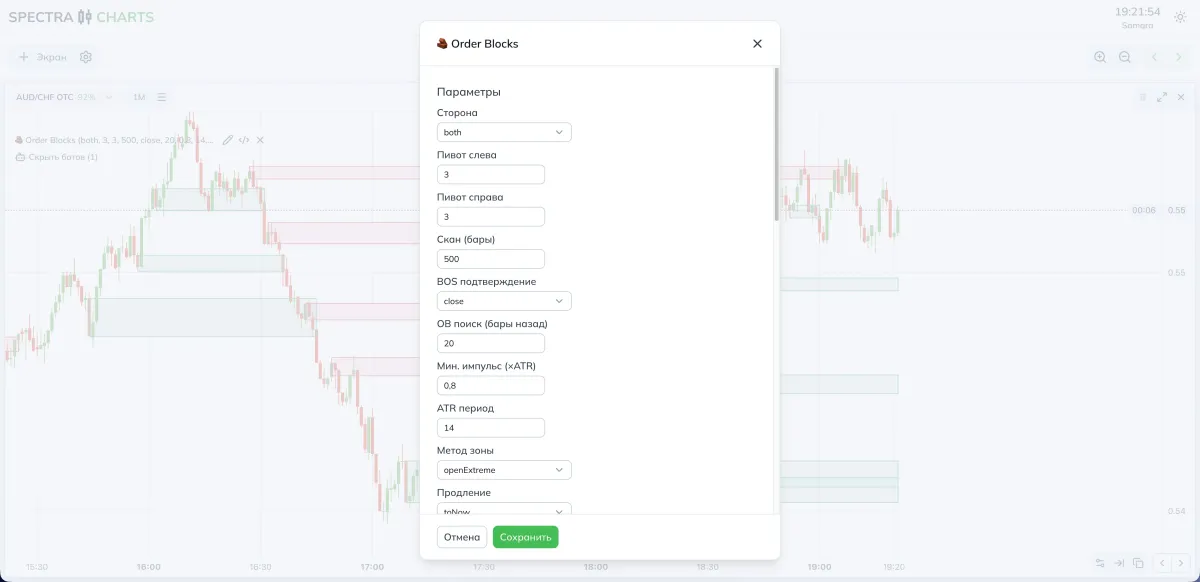
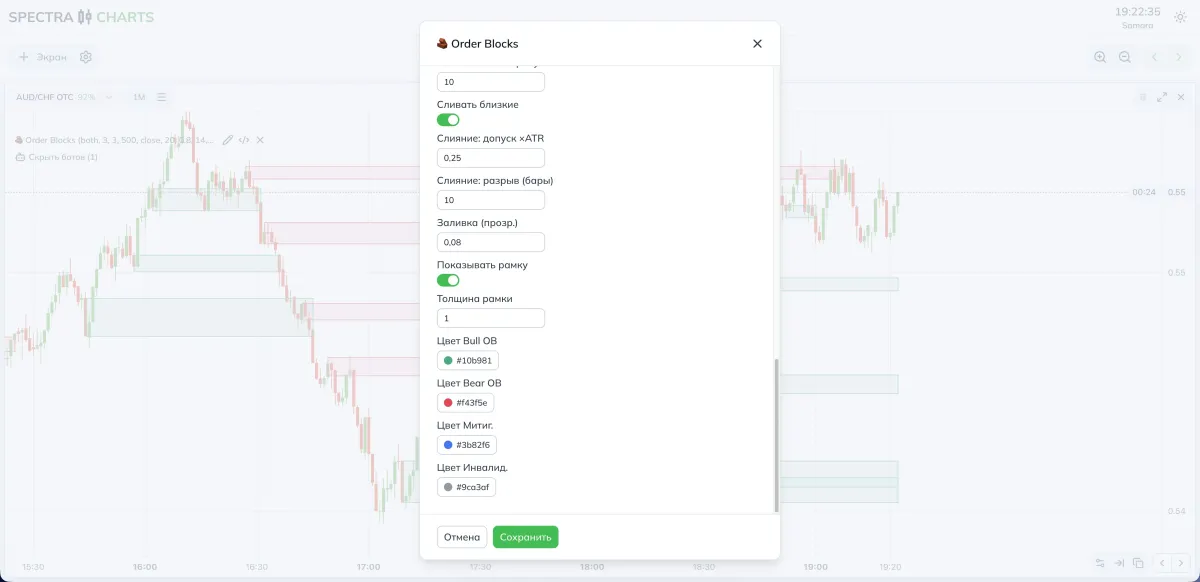
Parameters and what they do
Below we describe all settings as they appear in the interface. Compare the columns to quickly understand what happens if you set a value lower or higher.
1) Structure logic and BOS
| Parameter | What it does | If you decrease | If you increase |
|---|---|---|---|
| Side | Filter by zone type — bullish, bearish, or both | — | — |
| Pivot left | Swing strictness on the left side | More swings, more sensitivity | Fewer swings, but stronger |
| Pivot right | Swing strictness on the right side | Confirms a peak earlier | Lags more, but cleaner |
| Scan, bars | History depth to search | Faster, less context | Sees structure farther |
| BOS confirmation | Measure the break by close or wick | More signals | Stricter, rarer signals |
2) Searching for the source candle
| Parameter | What it does | If you decrease | If you increase |
|---|---|---|---|
| OB search, bars back | How far back to search for the source candle | Source is closer, more local | Can catch a farther, stronger one |
| Min impulse, ×ATR | Required break strength relative to volatility | More zones, sometimes weaker | Fewer zones, but higher quality |
| ATR period | Volatility estimate for the filter | More sensitive to noise | Smoother and more stable |
3) Zone geometry and extension
| Parameter | What it does | If you decrease | If you increase |
|---|---|---|---|
| Zone method | body, wick, openExtreme | Narrow body-based zone | Wider by wicks, or hybrid from open |
| Extension | How to extend the area to the right | Short tails | To current price or for N bars |
| N extension bars | How far to extend in nBars mode | Shorter relevance | Zone stays on screen longer |
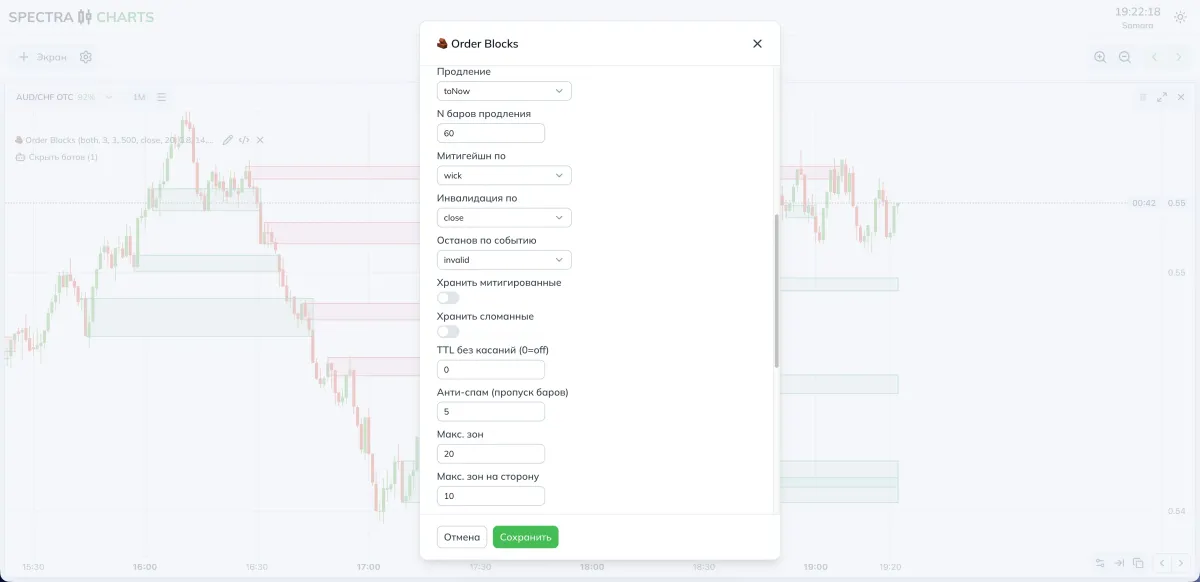
4) Events and zone behavior
| Parameter | What it does | If you relax | If you tighten |
|---|---|---|---|
| Mitigation by | Count a touch by wick or by close | More retests | Fewer, but clearer |
| Invalidation by | Count a break by wick or by close | Earlier break | Break is rarer but more confident |
| Stop on event | Where to stop extending — on retest, break, or any | Zones stay longer on screen | Chart is cleaner and more disciplined |
| Keep mitigated | Keep the zone after a touch | Useful history | May clutter the screen |
| Keep invalid | Keep broken zones | Post-factum analytics | Better to hide the excess |
| TTL without touches | Auto-remove fresh zones without retest | Cleaner view | Zone history stays longer |
5) Anti-spam and merging
| Parameter | What it does | If you decrease | If you increase |
|---|---|---|---|
| Anti-spam, skip bars | Pause after a zone is fixed | More duplicates | Smoother, cleaner flow |
| Max zones | Overall zones cap on chart | More clutter | Easier visually |
| Max zones per side | Cap for bullish or bearish | Balance may skew | Balance enforced |
| Merge close ones | Enable merging of areas | Small zones stay separate | Neighbors merge into a “belt” |
| Merge tolerance ×ATR | How close in price they must be | Merges less often | Merges more aggressively |
| Merge gap, bars | How close in time | Requires adjacency | Allows a time gap |
6) Visual
| Parameter | What it does | If you decrease | If you increase |
|---|---|---|---|
| Fill, opacity | Rectangle brightness | Subtler on background | Brighter and more noticeable |
| Show border | Zone outline | Minimalism | Easier to read boundaries |
| Border thickness | Outline thickness | Elegant | Emphasis on the level |
| Bull OB color | Palette for bullish zones | — | — |
| Bear OB color | Palette for bearish zones | — | — |
| Mitigated color | Color after retest | — | — |
| Invalid color | Color for a broken zone | — | — |
Practical presets
- BOS confirmation — by close
- Zone method — openExtreme
- OB search, bars back — 15–20
- Min impulse, ×ATR — 0.6–0.9
- Stop on event — either any, or invalid if you prefer strict cleanliness
- Anti-spam — skip 5–7 bars
- Merging — on; tolerance 0.20–0.30 ATR; gap 6–10 bars
- BOS confirmation — by close
- Zone method — body, for tidier areas
- OB search, bars back — 20–30
- Min impulse, ×ATR — 0.8–1.2
- Extension — nBars, 30–120 bars
- Stop on event — invalid, to avoid keeping dead areas
- Merging — on; tolerance 0.25 ATR; gap 8–12 bars
How to tune for yourself
- Want more signals:
- Lower Min impulse, ×ATR,
- Relax BOS confirmation to the wick option,
- Reduce Pivots and Anti-spam,
- Keep Merging enabled so the picture doesn’t sprawl.
- Want fewer but cleaner:
- Raise Min impulse, ×ATR,
- Keep BOS by close,
- Increase Pivots,
- Enable Stop on event = any,
- Add TTL without touches and raise Merging requirements.
Useful combinations with other tools
- Order Blocks + imbalances. If an OB zone aligns with a price gap, the retest often turns out energetic.
- Order Blocks + liquidity sweeps. A sweep of a level inside the zone strengthens the pullback scenario.
- Order Blocks + Summary HUD. Use the HUD as a context filter; if the HUD says wait, skip the entry even with a nice zone.
Step-by-step strategy for binary options
BUY from a bullish zone
There is a BOS upward, a bullish zone is built. Wait for a retest of the zone by your rule — by wick or by close. If the retest is confirmed and the current context doesn’t contradict it, plan the entry on the next candle.
SELL from a bearish zone
There is a BOS downward, a bearish zone is built. On the retest, wait for a confirmation downward. Enter on the next candle.
Expiration
For OTC start with one candle; in a calm trend test two. On the real market, two candles also make sense if the backdrop is stable.
Risk management
Fixed trade size. Re-enter only after a new contact with the zone or when a new zone appears. If the zone is invalidated (broken), cancel the scenario.
FAQ
Raise Min impulse, ×ATR, increase Pivot left and Pivot right, enable Stop on event, and limit Max zones and Max zones per side. Keep Merge close ones on and tune Merge tolerance ×ATR and Merge gap, bars for your timeframe.
Set Extension = nBars and specify N extension bars; add TTL without touches. If you want auto-cleanup on any event, choose Stop on event = any.
Switch Mitigation by to close — then a close inside the zone is required, not just a wick touch.
Keep Merge close ones enabled and adjust Merge tolerance ×ATR and Merge gap, bars for your timeframe so neighboring areas combine.
Conclusion
The Order Blocks indicator does one simple thing and does it neatly. It finds a source candle after a BOS (break), builds a demand or supply zone, extends it until mitigation or invalidation, and helps you see logical entry points. For Pocket Option in Spectra Charts it’s a convenient base for education and for strategies without unnecessary complexity. Tune sensitivity to your style, keep the chart clean, and trade only where the market truly shows interest.
Indicator Summary Analytics HUD — overall market assessment card
On-chart card: oscillators, trend, and a final verdict factoring in ADX, a neutral band, and hysteresis. TF 10s–10m presets, fine sensitivity tuning for Pocket Option in Spectra Charts.
Indicator Range Detector — one-click range and breakout detection
Automatically finds price ranges around the SMA with ATR-based width, extends zones, labels upside/downside breakouts, and marks broken zones in gray. Ready-made presets for Pocket Option in Spectra Charts.