Indicator Summary Analytics HUD — overall market assessment card
What it is and why
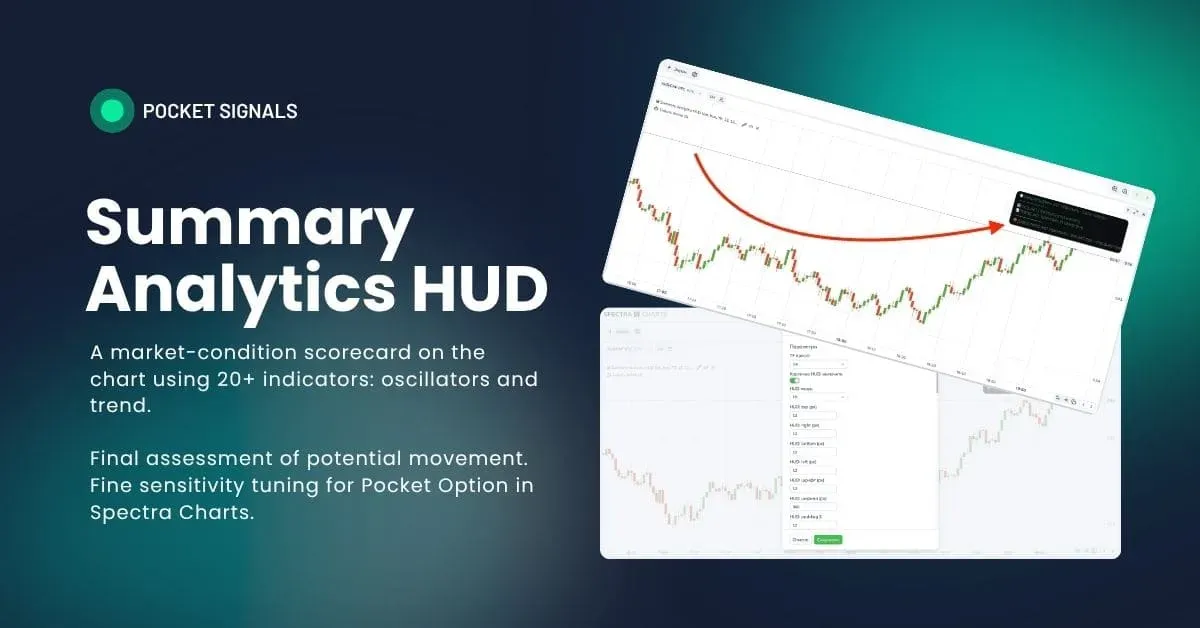
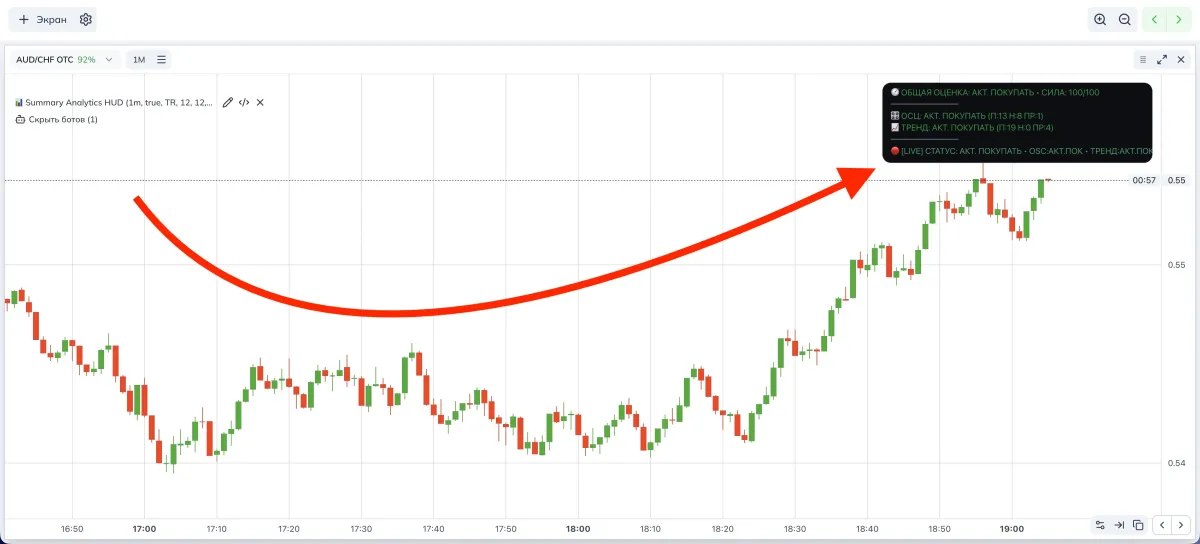
Summary Analytics HUD is a compact card on the chart that, in real time, aggregates votes from dozens of signals (oscillators and trend), weights them by trend strength (ADX), accounts for a neutral band and hysteresis (anti-chatter), and then outputs a clear verdict: BUY / SELL / WAIT.
The card updates LIVE and shows two zones: the result for the closed candle and the current status.
For binary options on Pocket Option in Spectra Charts, the HUD helps quickly filter out weak moments and enforce discipline in ready-made strategies. In PoSignals materials, we use it as a top-level filter in the education section and as a visual indicator of the “market context.”
How the HUD works
- Oscillator basket: RSI, Stochastic, StochRSI, CCI, Williams %R, Momentum, ROC, TRIX, Ultimate Oscillator, AO, CMO, %B, DeMarker, DPO, MACD/PPO (histogram), Aroon Osc, Vortex, Fisher, TSI, KDJ, RVI. Each provides a vote and energy.
- Trend basket: price vs MA ribbon (SMA/EMA/HMA/TEMA/DEMA/ZLEMA/ALMA/KAMA), EMA crosses, BB-mid, Keltner/Donchian, PSAR, Supertrend, Ichimoku, DMI/ADX, Heikin-Ashi.
- ADX weighting: with a weak trend, more trust in oscillators; with a strong one — in trend signals.
- Neutral band with expansion during squeeze.
- Hysteresis: protects from false flips near boundaries.
- LIVE EMA: smooths the current-bar total strength S so it doesn’t “blink” every second.
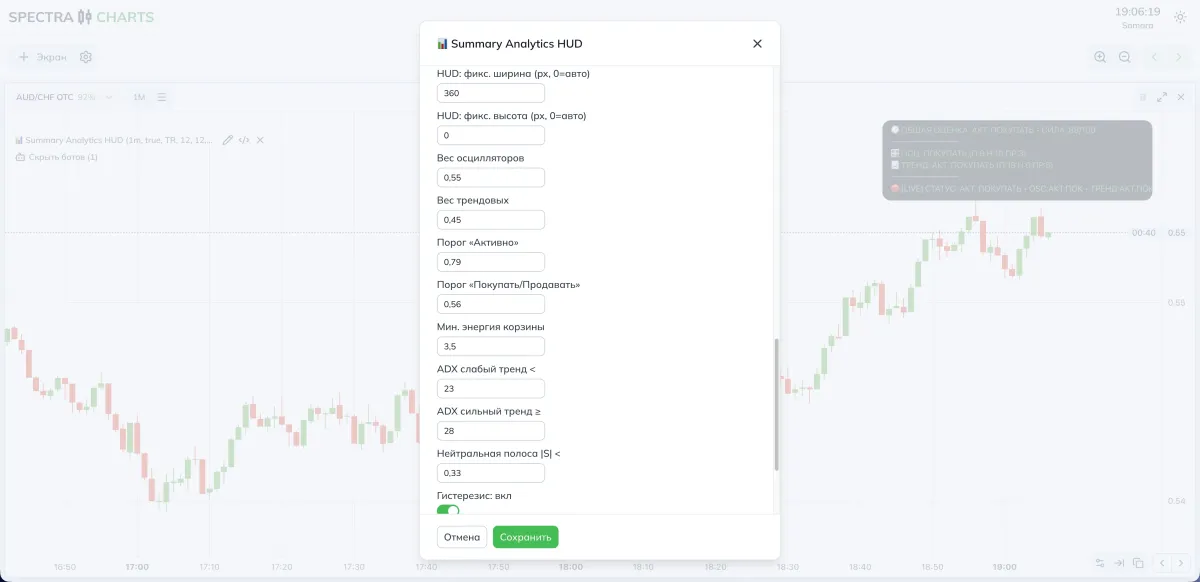
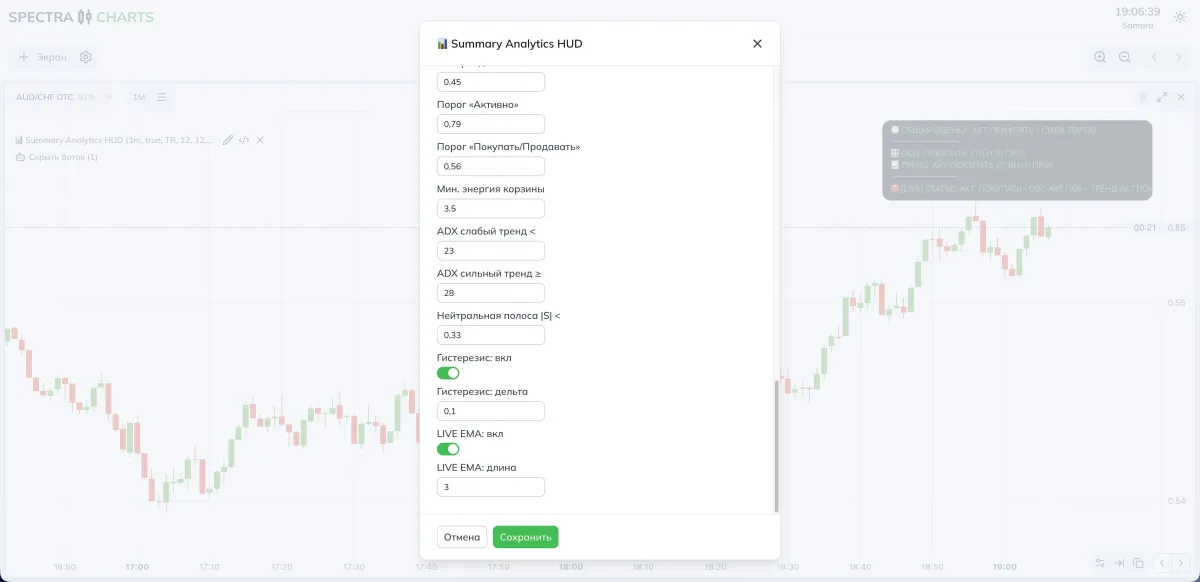
Indicator parameters (visual)
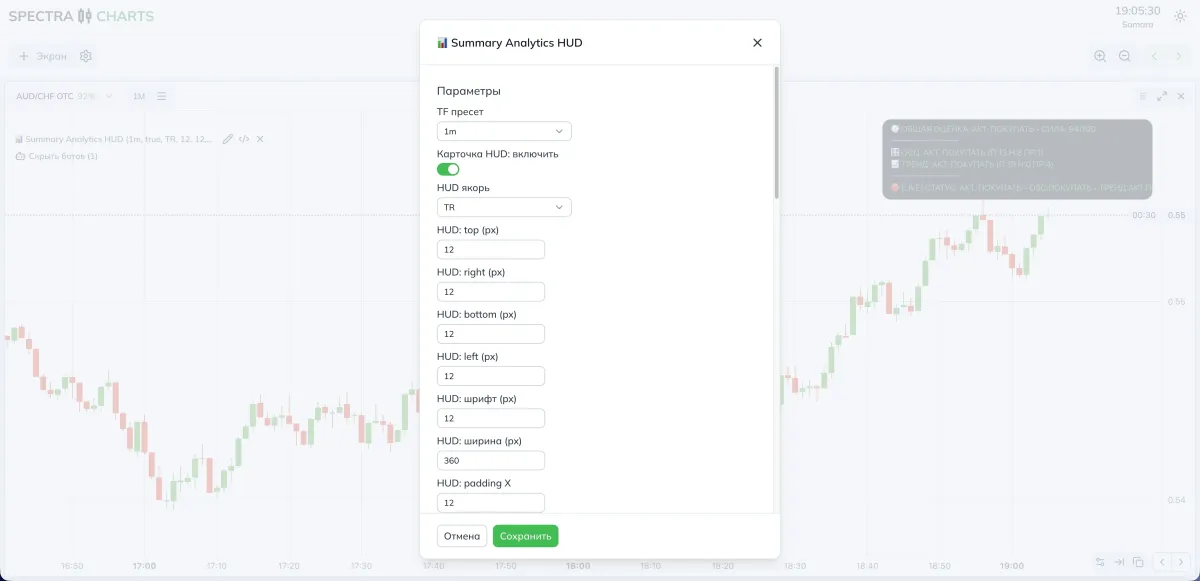
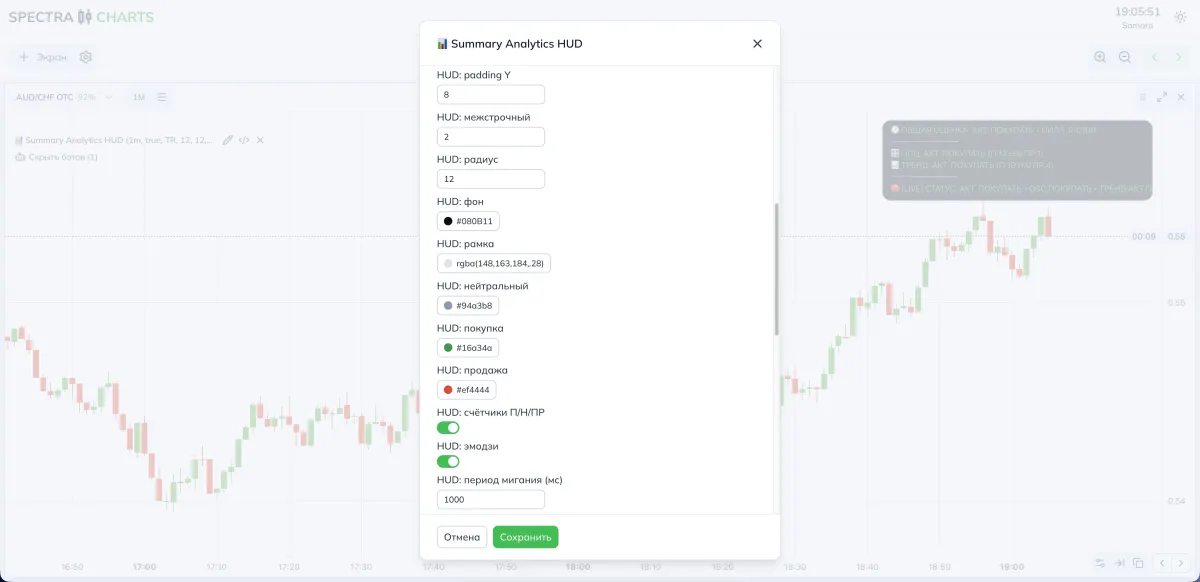
Card appearance
| Parameter | What it does | If you decrease | If you increase |
|---|---|---|---|
| HUD anchor / padding | Position: TR / BR / BL + margins | Card closer to the edge | More breathing room |
| Font / width / radius | Readability and compactness | Saves space | Larger, easier to read |
| Colors: neutral/buy/sell | Status palette | Lower contrast | Brighter separation |
| Blinking LIVE | Period in ms | Faster, more active | Calmer indicator |
Logic and sensitivity
| Parameter | Purpose | If you decrease | If you increase |
|---|---|---|---|
| Weights: oscillators / trend | Basket balance | More reversal hints | More trend following |
| “Active” threshold | Strong-signal boundary | Easier to light “ACT.” | “ACT.” rarer, cleaner |
| “Buy/Sell” threshold | Soft boundary | More entries | Stricter filtering |
| Min. basket energy | How many votes are needed | Less “WAIT” | More “WAIT” with weak consensus |
| ADX weak/strong | Shifts weight between baskets | More emphasis on oscillators | More on trend |
| Neutral band | Dead zone around zero | More sensitive | Calmer, less noise |
| Hysteresis: delta | Slows sign flips | More switches | Less “chop” |
| LIVE EMA: length | Smoothing of the LIVE line | Reacts faster | Smoother, slightly later |
- More triggers — lower the neutral band and thresholds, reduce hysteresis, slightly raise the oscillator weight.
- Fewer but cleaner — raise the neutral band, hysteresis, and thresholds, shift weight toward the trend.
Modes and presets
- TF preset: 10s–30s or 1m
- Neutral band: 0.28–0.32
- Hysteresis Δ: 0.08–0.10
- “Buy/Sell” threshold: 0.55–0.58
- “Active” threshold: 0.78–0.80
- ADX weak/strong: 22 / 28
- Basket balance: oscillators 0.60–0.65, trend 0.35–0.40
- Tip: for short expirations, fast reaction matters — keep LIVE EMA shorter (2–3)
- TF preset: 1m–5m (sometimes 10m)
- Neutral band: 0.32–0.38
- Hysteresis Δ: 0.10–0.14
- “Buy/Sell” threshold: 0.58–0.62
- “Active” threshold: 0.80–0.84
- ADX weak/strong: 20 / 30
- Basket balance: oscillators 0.50, trend 0.50 or 0.40/0.60 in favor of trend
- Tip: during news, add 1–2 points to thresholds to cut “spikes”
How to combine with signals
- Pre-entry filter: use the HUD as a “pass/stop.” If the result is WAIT, skip the trade from any signal bot.
- Trade direction: take entries only in the BUY/SELL direction; “ACT.” is a reason to prioritize the trade.
- TF alignment: for 30s–1m signals use tfPreset = 30s/1m; for bots with 2–5 minutes use 2m–5m.
Trading plan
BUY
The card outcome on the closed candle is BUY or ACT. BUY, and the LIVE line does not contradict it.
Plan the entry on the next candle.
SELL
The card outcome on the closed candle is SELL or ACT. SELL, and the LIVE line does not contradict it.
Plan the entry on the next candle.
Expiration
For OTC start with one candle, then test two in a sustained trend.
On the real market, two candles are acceptable if ADX is in the “strong” zone and the trend basket dominates.
Risk
Fix your trade size; do not increase the stake if the card goes to WAIT.
Re-enter only after new confirmation on a closed candle and no conflict with LIVE.
FAQ
Increase the neutral band and hysteresis, lengthen the LIVE EMA. If needed, raise the thresholds.
Lower the neutral band and thresholds, reduce hysteresis, and temporarily shift the balance toward oscillators.
For 30s–1m entries choose 30s/1m; for 2–5 minutes — 2m/3m/5m. Don’t mix very different timeframes in one session.
If the result is WAIT or baskets disagree, skip the entry. The HUD is a context filter — it saves trades in a weak environment.
Summary
Summary Analytics HUD turns dozens of indicators into one clear verdict and helps build entry discipline. For Pocket Option in Spectra Charts, it’s a handy layer on top of any strategy: less noise, more clear decision points. Finely control sensitivity (neutral band, hysteresis, thresholds) and the balance between oscillators and trend — this adapts the card to your style.
Indicator ZigZag Channels — dynamic channels from extremes
ZigZag based on confirmed extremes, automatic channel boundaries and price labels. How the markup is built, which parameters affect visibility and clarity, presets for OTC and the real market, and a working entry plan.
Indicator Order Blocks — automatic supply and demand zones
Clear search for the source candle after BOS, building zones by body, wick, or from the open, extending until mitigation or invalidation, merging nearby areas. Ready-made presets for Pocket Option in Spectra Charts.