Indicator ZigZag Channels — dynamic channels from extremes
What is ZigZag Channels
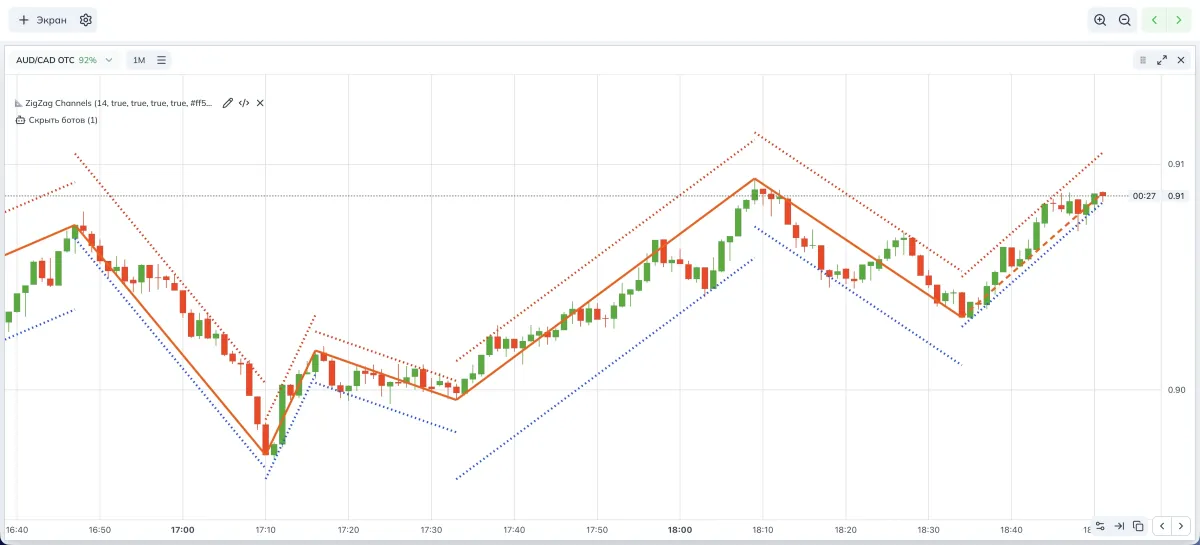
ZigZag Channels draws a center line through a sequence of extremes and automatically places the upper and lower channel boundaries. For each segment between two anchor points, the indicator evaluates the actual price deviation, so the boundaries are adaptive rather than fixed.
How the indicator works
- Anchor points are determined using a window of length
Window length. - A ZigZag polyline connects neighboring anchors.
- For each segment, the maximum price deviation above and below the polyline is calculated, after which the channel boundaries are drawn.
- Optionally, lines can be extended to the current candle so the channel stays up to date.
- On extremes you can show price labels or points to read levels more easily.
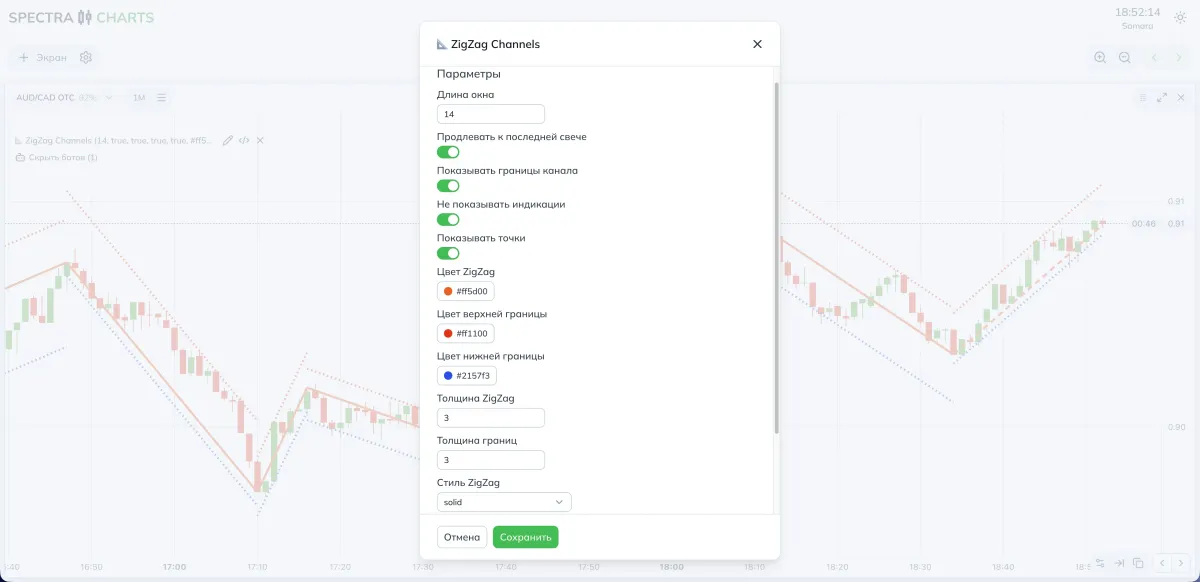
Parameters and impact
Display
| Parameter | What it does | If disabled | If enabled |
|---|---|---|---|
| Extend to the latest candle | Stretches segments to the current bar | Channel ends at the last anchor | You can see where price sits inside the current channel |
| Show channel boundaries | Enables the upper and lower lines | Only the central ZigZag | Full channel with outlines |
| Hide price labels | Hides price labels on extremes | Labels are visible | Cleaner chart in fast modes |
| Show points | Places points on extremes | No points | Faster to read inflections |
Geometry
| Parameter | Meaning | If you decrease | If you increase |
|---|---|---|---|
| Window length | How many bars are analyzed in the sliding window | More anchors; channel reacts faster | Fewer anchors; channel is smoother |
| History limit | Max number of bars to use | Faster, but shorter history | Longer history, more segments |
Style
| Parameter | Usage |
|---|---|
| ZigZag color, ZigZag thickness, ZigZag style | Styling for the central line |
| Upper boundary color, Lower boundary color, Boundary thickness, Boundary style | Styling for the channel |
- Need more detail — reduce Window length and enable points on extremes.
- Want a cleaner picture — increase Window length, turn off labels, keep only the boundaries.
Modes and presets
- Window length: 20
- Show channel boundaries: yes
- Extend to the latest candle: yes
- Indicators: points on extremes; labels can be disabled
- Style: medium ZigZag thickness; boundaries dashed
- Window length: 20–30
- Show channel boundaries: yes
- Extend to the latest candle: yes
- Indicators: points or labels depending on context
- Style: thinner boundaries to avoid clutter on long stretches
Where to look in Spectra Charts
- Open an asset on Pocket Option in Spectra Charts
- Connect ZigZag Channels
- Check the Window length and desired display parameters
- Assess price location inside the channel and the nearest boundary
Trading plan
BUY
Consider a pullback to the lower channel boundary with brief confirmation in the direction of the bounce.
If there was a fresh touch from below, the probability of a return to the middle is higher.
SELL
Consider a pullback to the upper channel boundary with a local refusal to keep rising.
The signal is strengthened if the previous channel stretch moved without deep corrections.
Expiration
One candle in fast scenarios.
On calmer stretches, you can extend to two or three candles after checking your own stats.
Risk
Fixed trade size and one active position within the current channel.
Re-entry only after a new touch of the boundary or a change of the ZigZag segment.
FAQ
An anchor is confirmed by a bar window; until the window is filled, edge points may shift. Increase Window length to reduce movement.
Decrease Window length and use thinner boundaries. This will bring the channel closer to price and make it more responsive.
Disable labels, leave only points, or remove them entirely. Keep the channel boundaries as a guide.
Summary
ZigZag Channels provides a clear dynamic channel and convenient landmarks for pullbacks and continuations. Adjust detail via Window length and reduce visual noise through display parameters to make faster decisions on Pocket Option in Spectra Charts.
Indicator Liquidity Sweep — sweeps from clustered levels
Clusters of swing levels, live support/resistance lines, SWEEP markers on price overshoot and return. Tolerance settings via ATR or %, presets for OTC and the real market, working plan.
Indicator Summary Analytics HUD — overall market assessment card
On-chart card: oscillators, trend, and a final verdict factoring in ADX, a neutral band, and hysteresis. TF 10s–10m presets, fine sensitivity tuning for Pocket Option in Spectra Charts.