Candlestick patterns in trading: how to find, filter, and apply them on the chart
Candlestick patterns are recurring combinations of Japanese candles that help determine market sentiment:
- who is stronger right now — buyers or sellers;
- whether a reversal or trend continuation is likely;
- whether the moment appears when the market “changes its mind.”
It’s important to understand: a pattern by itself is not a “buy/sell button.”
It works only in context:
- at support and resistance levels;
- during strong price movements;
- together with the trend and additional filters (oscillators, levels, market context).
1. Main patterns
Bullish and bearish engulfing
Bullish Engulfing
After a red (falling) candle appears a large green candle (bigger than the red one) that completely engulfs the body of the previous candle.
👉 This indicates that buyers suddenly became stronger — possible reversal upward.
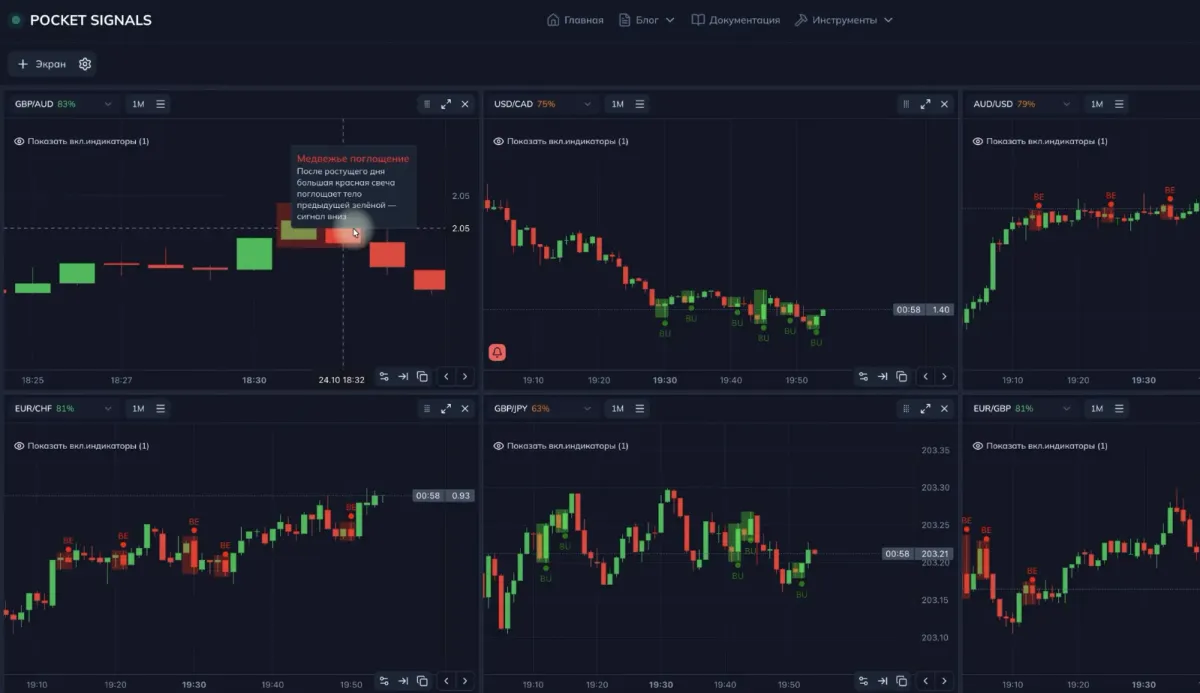
Bearish Engulfing
After a green candle forms a larger red candle that covers the previous candle’s body.
👉 A signal of seller dominance and possible downward movement.
📌 These patterns work best:
- at key support/resistance levels;
- at the end of a prolonged move (long uptrend or downtrend).
The example shows bearish engulfing (highlighted in red) and bullish engulfing (highlighted in green)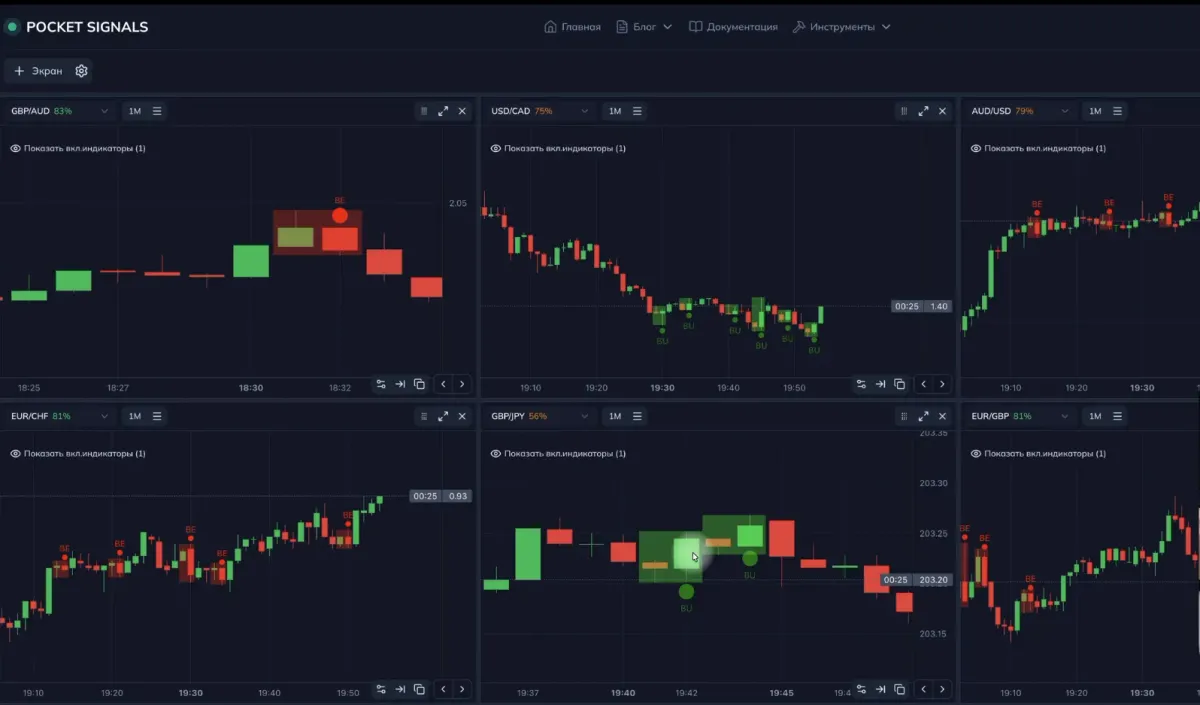
Harami
Bullish Harami
After a decline a small green candle appears inside the body of a large red candle.
👉 This may signal slowing of the drop and a possible reversal upward.
Bearish Harami
After a rise forms a small red candle inside a large green one.
👉 A potential reversal downward.
💡 Key difference from engulfing:
in engulfing, the second candle is large and “eats” the first;
in harami, the small candle is inside the large one.
Bullish Harami, a small green candle inside a large red one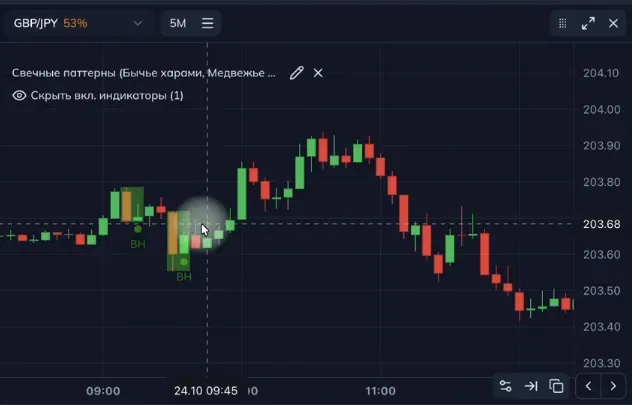
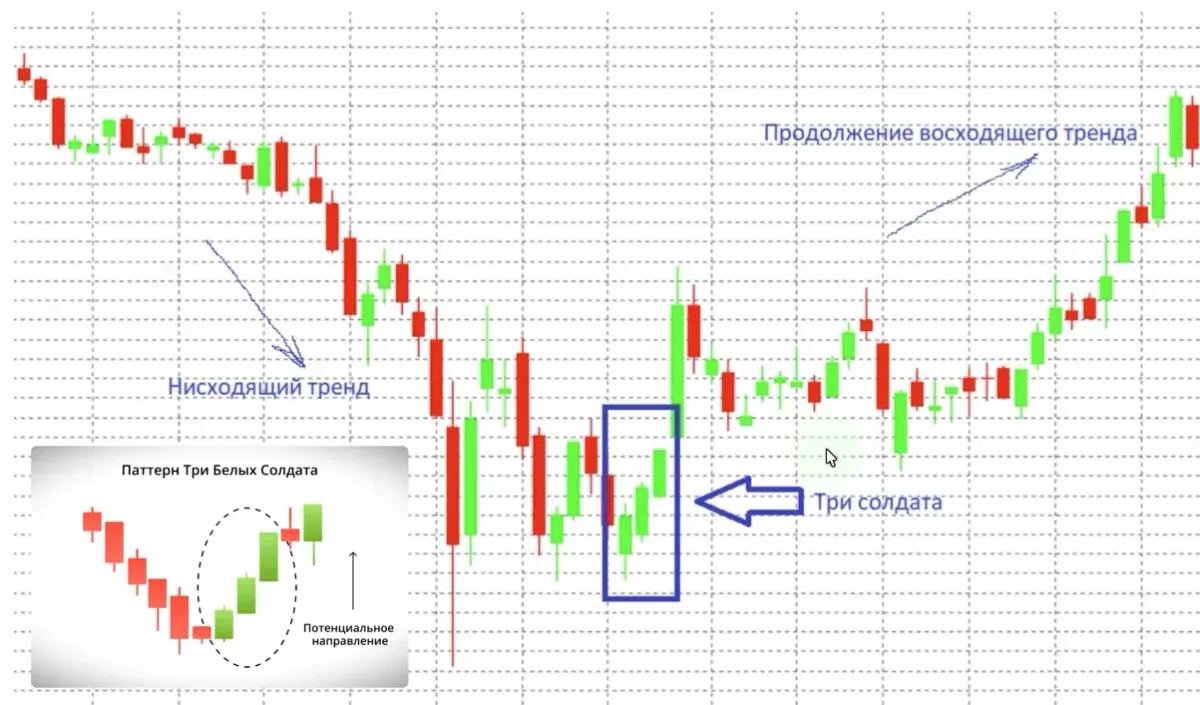
Three White Soldiers and Three Black Crows
Three White Soldiers
Three strong green candles in a row after a drop or a range.
👉 Often signals the formation of a new uptrend.
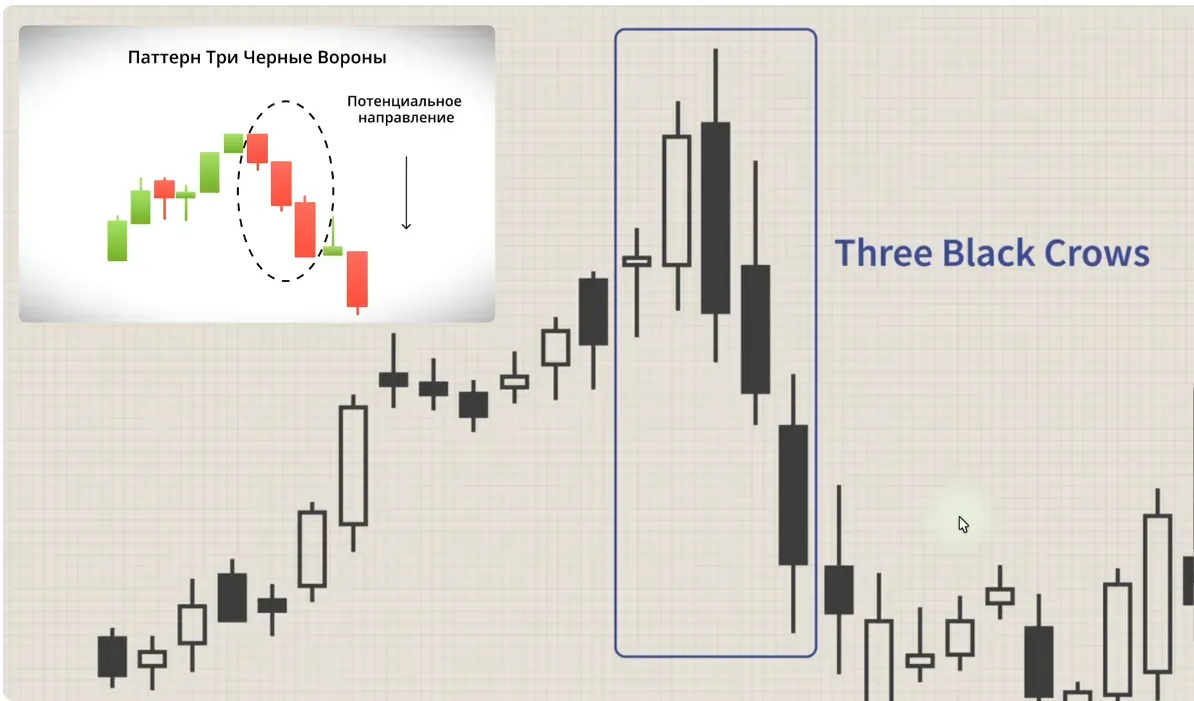
Three Black Crows
Three strong red candles in a row after growth.
👉 Sign of a possible reversal downward and start of a downtrend.
These patterns are used to confirm direction change, not to enter based on a single candle.
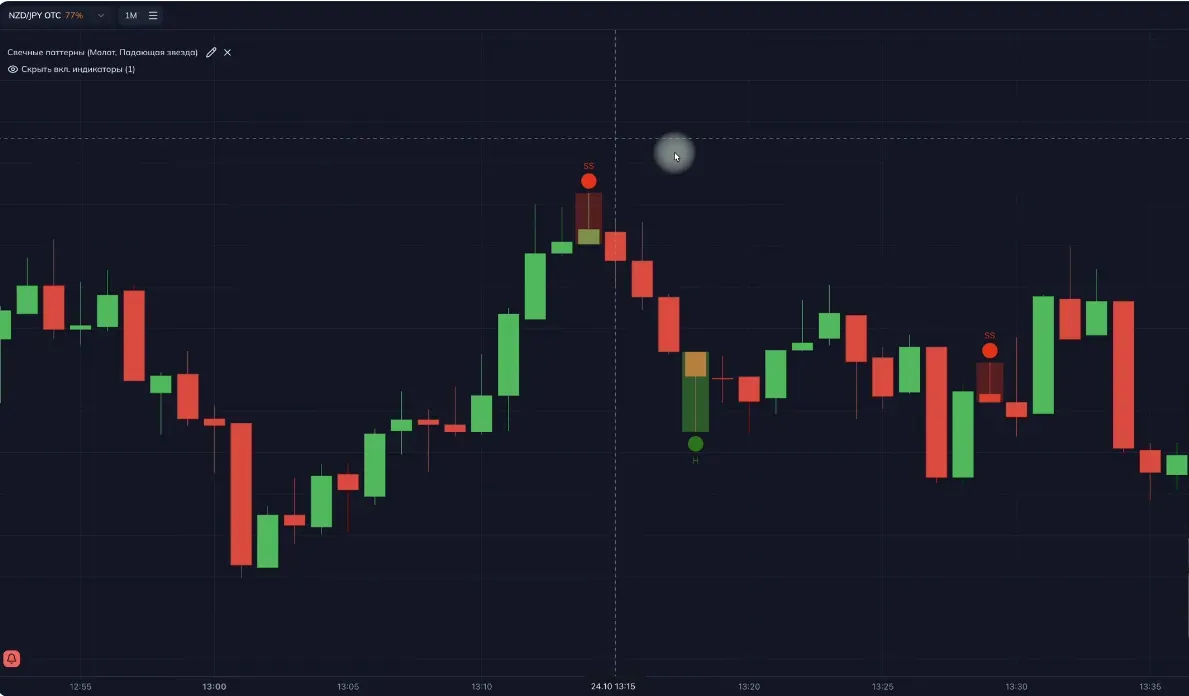
Hammer and Shooting Star
Hammer
- small body at the top of the candle;
- long lower shadow;
- appears after a decline.
👉 Shows that sellers tried to push the price down, but were bought out — possible growth.
Shooting Star
- small body at the bottom;
- long upper shadow;
- appears after a rise.
👉 Shows that buyers pushed the price up but were overwhelmed by sellers — possible reversal downward.
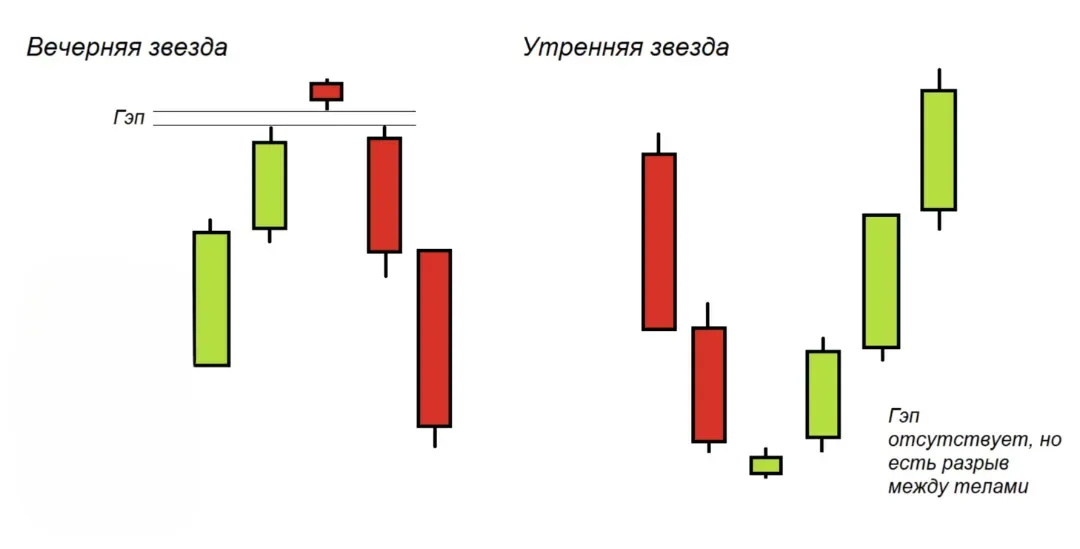
Evening Star and Morning Star
Evening Star — reversal pattern down after an uptrend.
Classic sequence:
- Long green candle.
- Small candle (doji or small body) with a gap.
- Long red candle.
Morning Star — mirror model, reversal up after a downtrend.
💡 The gap between candles strengthens the pattern and often signals a shift in market sentiment.
2. How to find patterns on the chart
To quickly find candlestick combinations, you can:
- use the Pattern Detector indicator (available on our SpectraCharts platform);
- enable specific patterns: engulfing, harami, hammer, star, etc.;
- always check the pattern against support/resistance levels.
Do not treat every found pattern as an entry signal.
Patterns work best:
- at strong levels;
- when movement slows after a trend;
- in combination with various indicators.
3. How to filter false signals
Even a correct candlestick pattern may fail if you don’t consider market context. To filter out “noise”:
Check higher timeframes (M5, M15, M30).
On M1 there are many signals but they are less reliable — too much noise.
Use support and resistance levels.
Pattern at a level → stronger.
Pattern in the middle of chaos → weaker.
Add an oscillator (Stochastic, RSI).
- Pattern in overbought zone → look for sells.
- Pattern in oversold zone → look for buys.
Avoid “saw” — a market with no direction.
Many small candles with long wicks and tiny bodies = no clear strength from either side.
4. Important nuances
- Patterns do not work alone — especially during news or sharp impulses.
- There can be false engulfing if not confirmed by volume, trend, or levels.
- Candlestick analysis must always be combined with:
- support/resistance,
- overall trend direction,
- additional indicators.
The key is learning to wait for the right situation, not entering every time you see a familiar candle shape.
5. How to learn to see patterns
To make candle combinations familiar:
- Use a demo account — mark where patterns appear and how price reacts afterward.
- Keep a trade journal:
- which pattern appeared,
- where it appeared (level/no level),
- the result of the trade.
- Focus first on 3–4 basic patterns:
- engulfing (bullish/bearish),
- harami,
- hammer,
- shooting star.
Over time you will begin to spot patterns even without indicators.
✅ Conclusion
Candlestick patterns are a powerful tool if used together with market context, not separately.
They help:
- catch reversals in time;
- confirm indicator signals;
- make informed decisions, not press buttons randomly.
📚 Practice, mark patterns on history and in real trading, analyze their performance — and over time you will read the chart like a book.
How to create an account on BingX, complete verification, and buy USDT for rubles via P2P
A detailed guide to registering on the BingX exchange, completing KYC verification, and safely buying USDT for rubles through P2P — step-by-step instructions for beginners.
Complete catalog of PoSignals tools — bots and indicators
A convenient alphabetical catalog of PoSignals bots and indicators: short descriptions and use cases for technical analysis when trading binary options on Pocket Option.