Guide: how to work with oscillators and indicators
If you already know how to read candles and draw levels, the next logical step is to master indicators and oscillators. These tools help you:
- understand where the market is overbought or oversold;
- see potential reversal moments;
- assess the direction and strength of price movement.
Let’s break everything down step by step in simple language.
1. Indicators and oscillators — what’s the difference?
Indicators
Indicators are tools that are plotted directly on the chart, on top of the candles.
They help you:
- see current and potential support and resistance levels;
- assess the strength and direction of the trend;
- track breakouts, corrections, and range expansions.
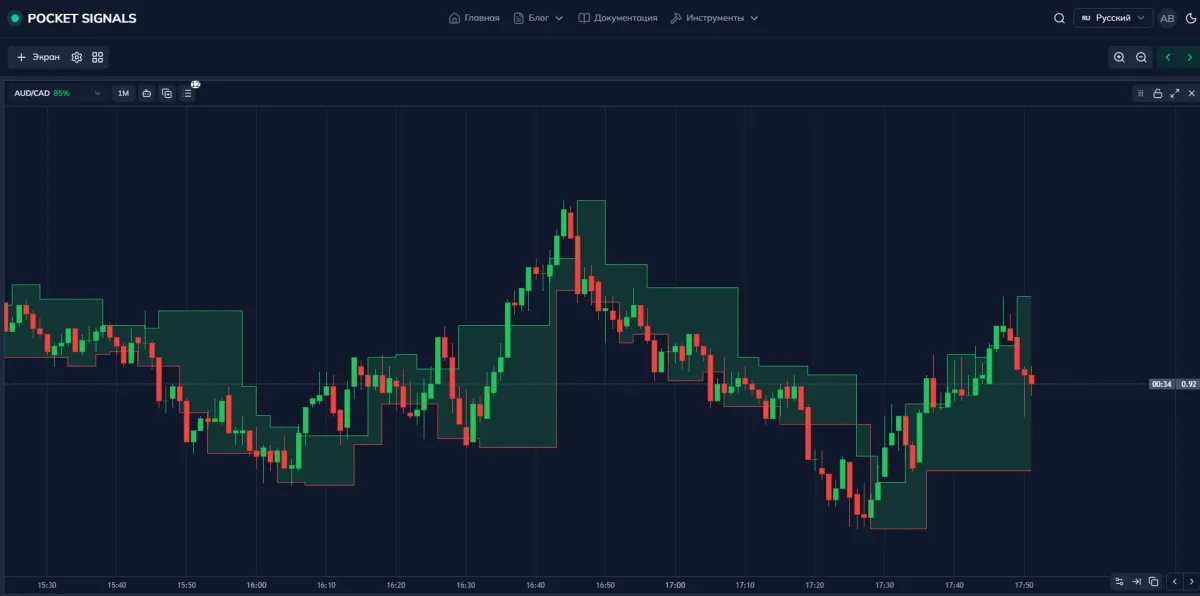
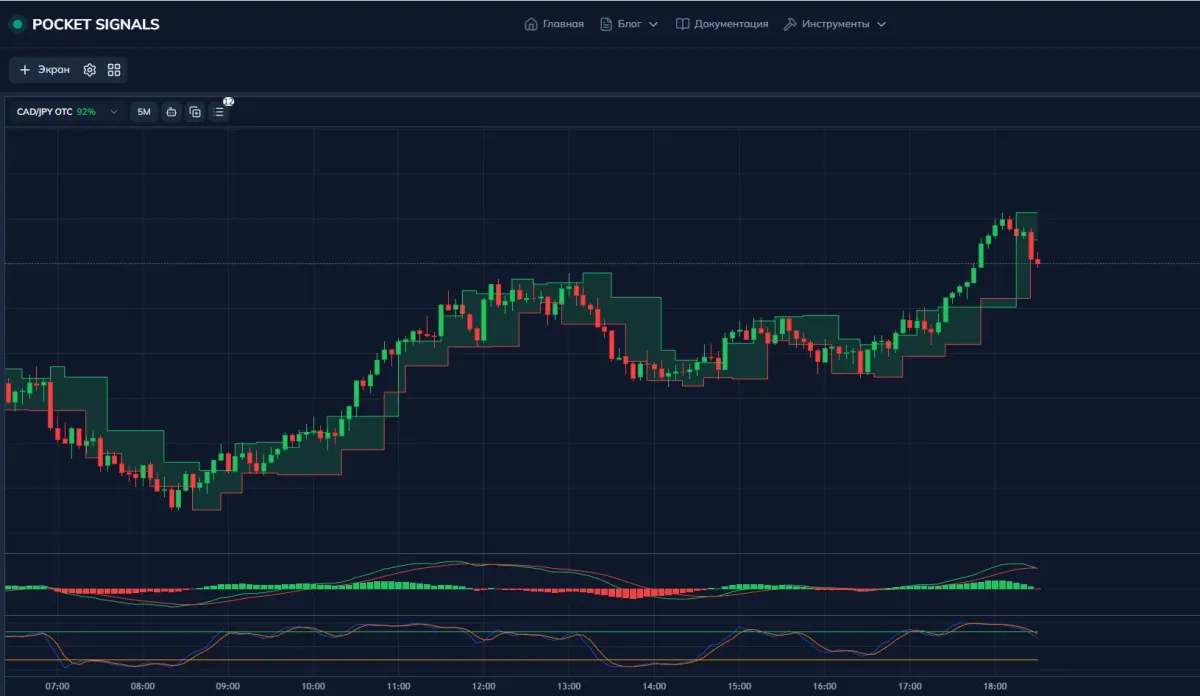
📘 Example: Fractal Chaos Bands (in the screenshot below) or Bollinger Bands — they help you see the corridor in which price is moving, and moments when it breaks beyond its usual boundaries during strong impulses.
Oscillators
Oscillators are located below the chart and show how far price has deviated from a “normal” state. Most often they move within a fixed range (for example, from 0 to 100) and help determine:
- 📈 overbought zone — when there have been too many buys and growth may slow down or turn into a decline;
- 📉 oversold zone — when there have been too many sells and a reversal upward is possible.
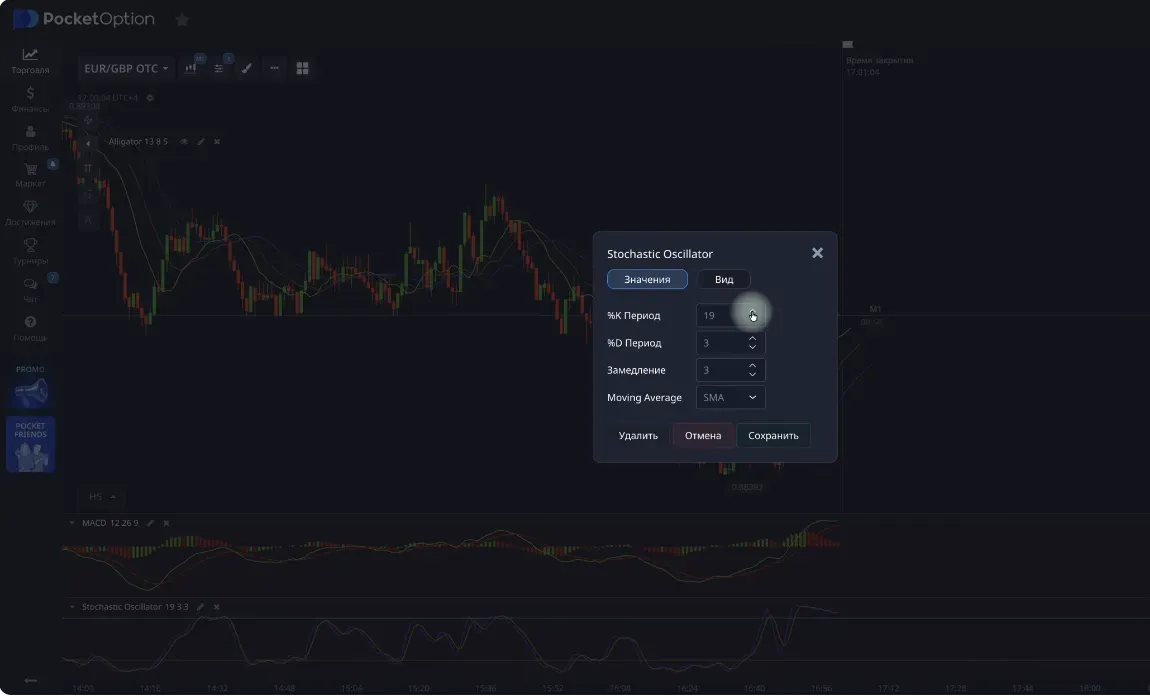
2. How oscillators work
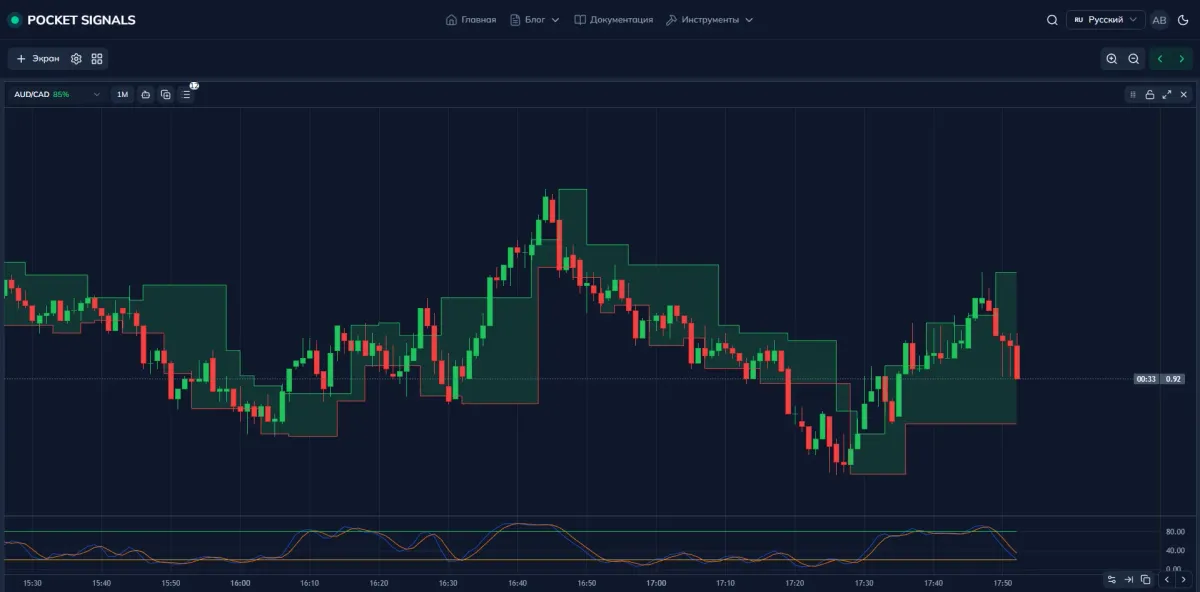
Let’s look at a classic example — Stochastic.
Standard parameters: 14, 3, 3.
Main zones:
- above 80 → overbought zone (the market is overheated, a correction or reversal down is possible);
- below 20 → oversold zone (the market is “sold off” too heavily, a reversal up is possible).
Signals:
- 1 cross of the lines from top to bottom in the overbought zone (above 80) — a possible sell signal;
- 2 cross from bottom to top in the oversold zone (below 20) — a possible buy signal.
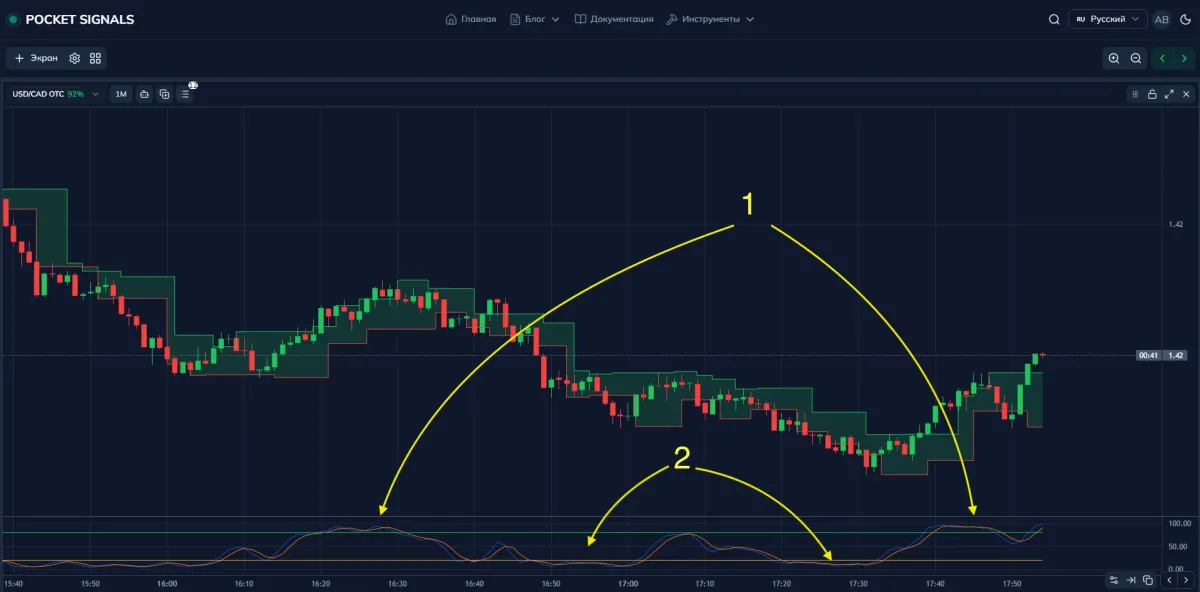
Important: the oscillator does not predict the future, it shows the state of the market — whether it is overheated or not.
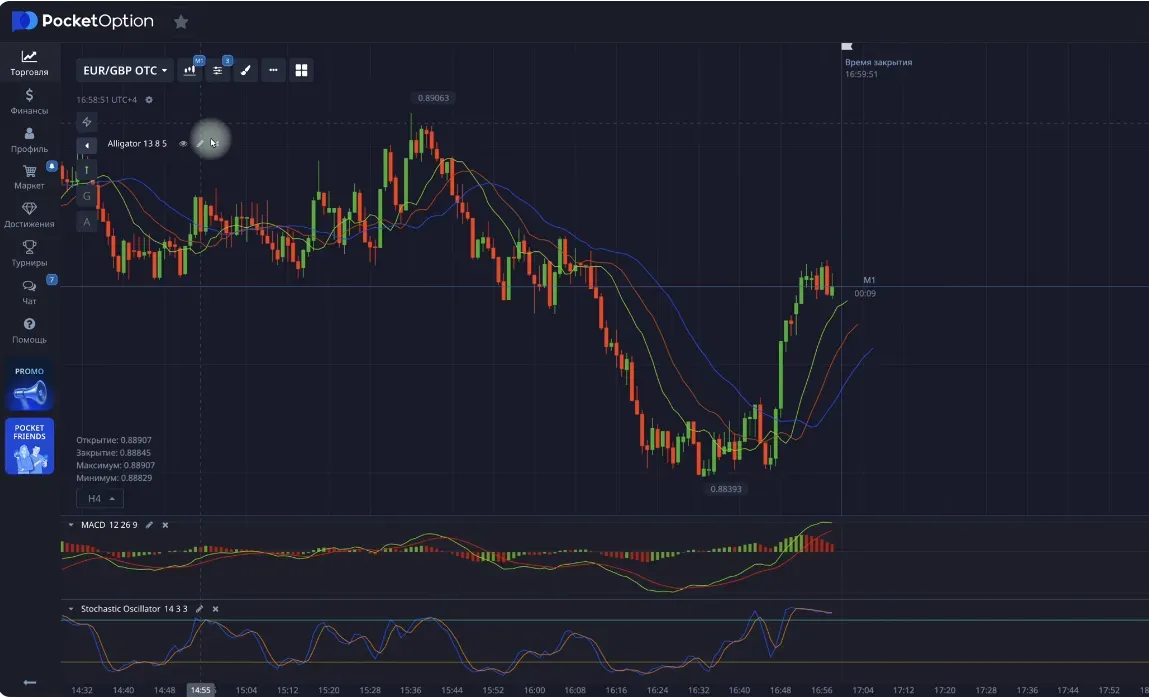
3. Oscillators in action: MACD + Stochastic combo
- There are many different strategy combinations, everything depends on the strategy you have chosen.
- Experience and knowledge come gradually, do not try to learn a lot of strategies at once.
To understand the market more accurately, traders often combine several tools.
One popular combo is MACD + Stochastic.
What they show:
- MACD — trend direction, impulse strength, and moments when the signal lines cross;
- Stochastic — the market state: overbought / oversold and whether it is ready for a correction.
💡 The logic is simple:
- if both tools are “pointing down” — this is additional confirmation of a sell signal;
- if both are “pointing up” — this strengthens a buy signal.
4. Example of chart analysis
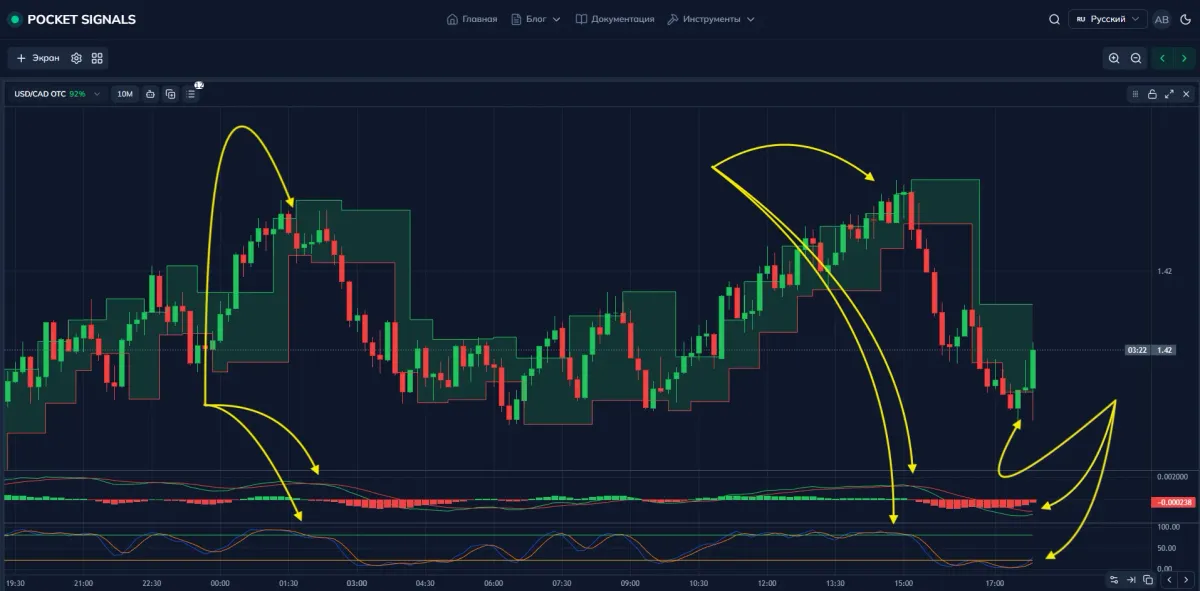
A conditional scenario:
- MACD shows a cross of the lines downward — the trend may switch to a downtrend.
- Stochastic enters the oversold zone and then turns — confirming the weakness of the rise and possible continuation of the decline.
- After a period of ranging, a breakout of the level upward occurs — you can now look for entries in the other direction, for buys.
This is almost a ready-made strategy, an example of how indicators and oscillators help:
- see trend changes;
- filter chaotic movements;
- avoid entering against an obvious impulse.
5. Trend indicators (mini selection)
Alligator
Alligator is an indicator based on three moving averages (3 lines).
- When the lines intertwine and then “spread apart”, traders say the “alligator’s mouth opens”. This is considered a signal that a move is starting.
- When the lines tighten up again — the market transitions into a range (sideways movement).
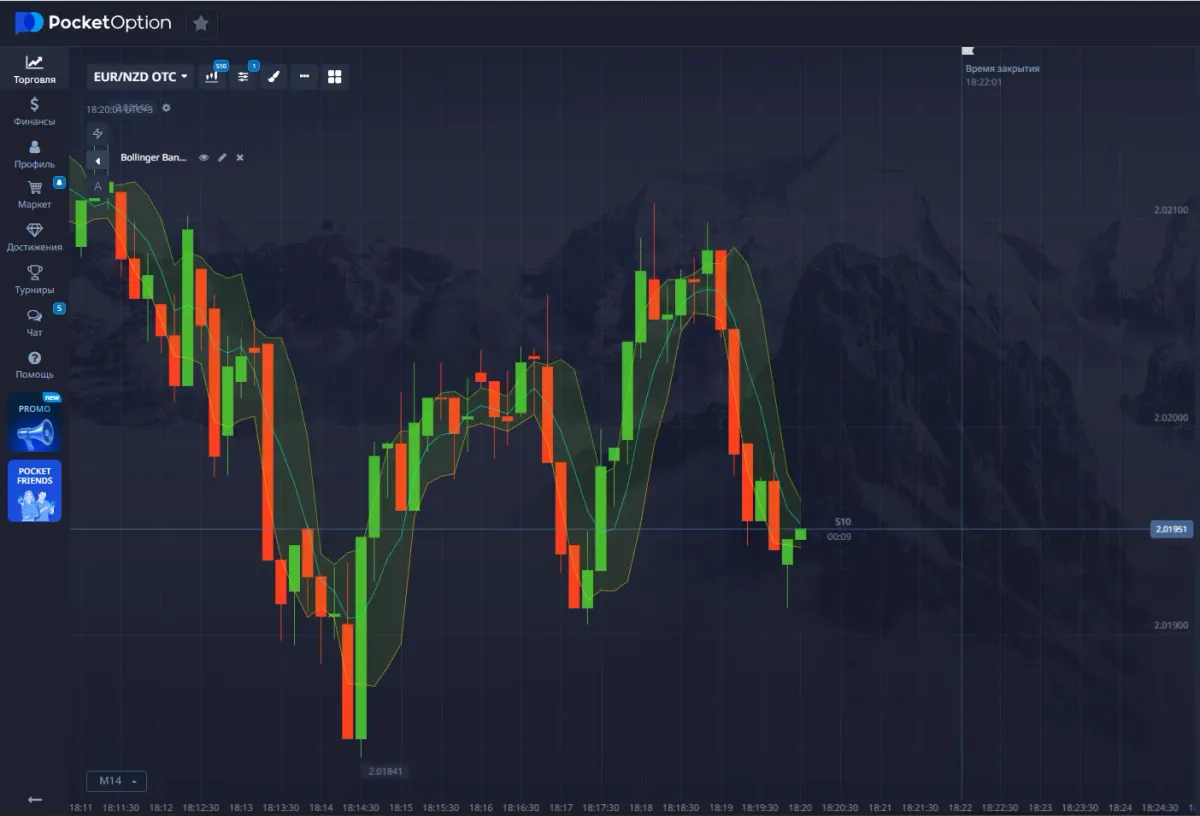
Bollinger Bands
Bollinger Bands show volatility and price range.
- Bands expand → volatility increases, the move becomes stronger.
- Bands contract → the market calms down, a breakout from the range is possible.
Signals:
- breakout of the upper band — possible continuation of growth or overheating;
- breakout of the lower band — possible further decline or oversold state.
6. How to adjust indicators for yourself
For most tools you can change:
- the period (how many candles are used for the calculation);
- smoothing (how “nervously” the line reacts);
- levels (for example, 20/80 for Stochastic).
💡 General rule:
- short period → the indicator is fast, gives many signals, but there is more noise and false entries;
- long period → fewer signals, but they are more reliable and tied to larger moves (sometimes there may be no signals at all and you miss entry points).
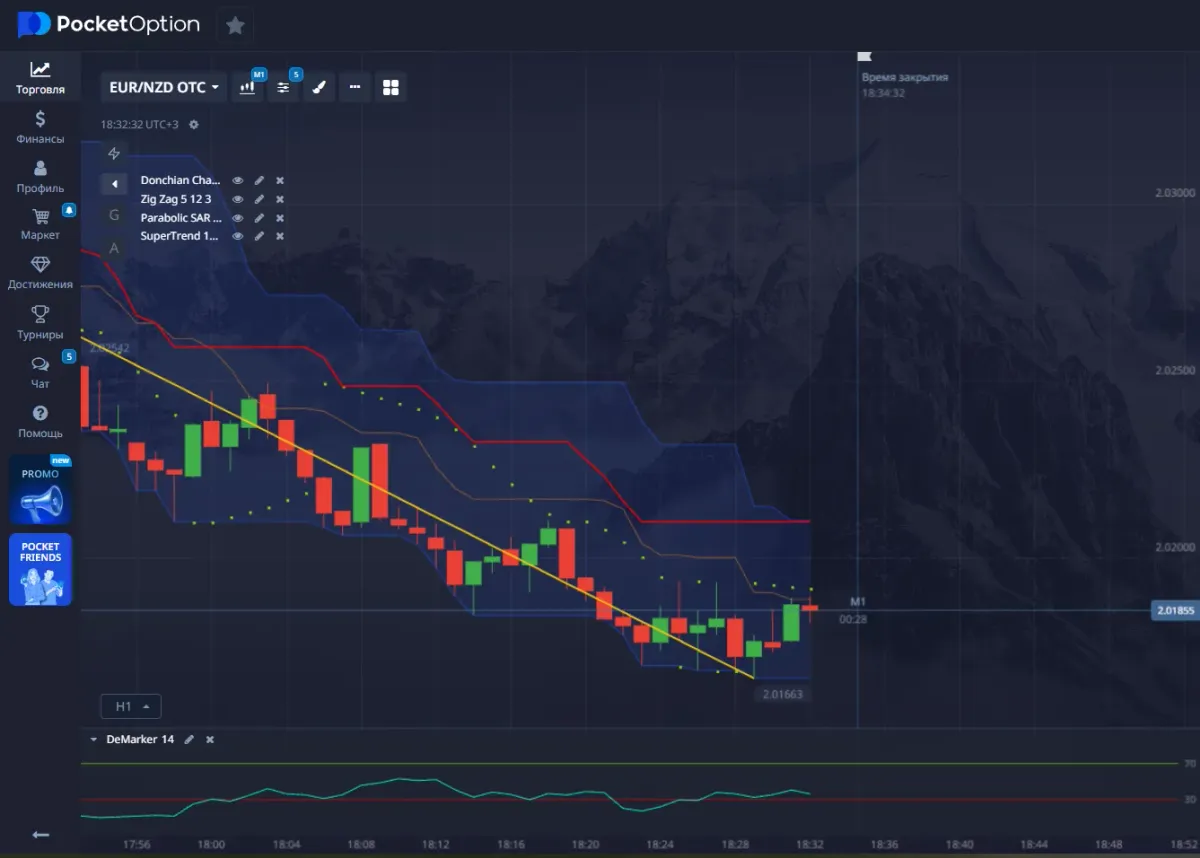
7. Other popular tools
Below is a quick cheat sheet on indicators and oscillators that are often used both on classic platforms and in binary options trading and on Pocket Option.
| Name | Type | What it shows |
|---|---|---|
| DeMarker | Oscillator | Overbought and oversold zones |
| Parabolic SAR | Indicator | Potential start of a new move (dots above/below the chart) |
| SuperTrend | Indicator | Trend change (the line changes color and side, acts as support and resistance) |
| Donchian Channel | Indicator | Price range, support and resistance levels |
| ZigZag | Indicator | Main peaks and troughs filtered from noise |
| Vortex | Oscillator | Direction of the current trend |
| Keltner Channel | Indicator | Volatility channel similar to Bollinger Bands |
8. How to combine indicators correctly
A common beginner mistake is to turn on everything at once. As a result, the chart turns into a Christmas tree instead of an analysis tool.
The optimal approach is to use 2–3 meaningful tools, for example:
- MACD — direction and strength of movement;
- Stochastic — market state (overbought / oversold);
- Fractal Chaos Bands — dynamic levels and trend direction.
This combo:
- helps filter out false signals;
- gives clearer entry points;
- does not overload the picture.
9. How to choose trade duration
The “timeframe → trade duration” link is especially important in binary options:
- you analyze the M1 chart → trades for 1–3 minutes;
- you analyze M5 → trades for 5–15 minutes;
- you analyze M30 → you can look for trades for 1–15 minutes.
The higher the timeframe, the:
- more smooth the moves;
- less random noise;
- calmer the trading.
10. Basic principles of working with indicators
Let’s sum up the basic rules:
- Indicators show past movement, not the future.
- Use them as confirmation, not as the only signal.
- Always test any combination on a demo account.
- Adjust parameters to your trading style and to the specific market.
- Always combine indicators with:
- Japanese candles,
- support and resistance levels,
- the overall movement context.
✅ Conclusion
Indicators and oscillators are trader’s helpers, not magic predictors. They give hints about the state of the market, but you are the one making the decision.
🎯 The main points:
- learn to notice patterns;
- work out signals first on a demo account;
- do not rush and do not rely on just one tool.
Account blocked: why this happens and how emotions destroy your deposit
Analysis of account blocking reasons, payout delays, and how emotional decisions of a trader lead to a blown deposit. Trading psychology for beginners.
Guide to Japanese Candles: how to read the chart, understand price movement, and build levels
A detailed guide to Japanese candles for beginners: candle structure, timeframes, support and resistance levels, trends, ranges, and practical chart reading.