Creating a Visual Tool for Spectra Charts with Line Drawing on the Chart
Creating a Visual Tool for Spectra Charts with Line Drawing on the Chart

In the previous tutorial post, we already covered how to create signal trading bots. In this material we take the next step and see how to configure a visual tool for Spectra Charts that can draw any straight and sloping lines directly on the chart.
This kind of tool is especially useful for those who trade binary options on Pocket Option, but do not want to manually draw every level and trend line. Our task is to teach the neural network to help you with this routine work and create clear candlestick charts with lines and zones that simplify analysis.
As you master creating different kinds of tools, you will be able to teach the neural network to:
- create signal bots with visual BUY and SELL arrows;
- draw horizontal support and resistance levels and zones;
- build sloping trend lines;
- visualize any indicators that are drawn over price.
It all depends on your experience, your goals, and your imagination. The key is to prepare prompts and code skeletons correctly.
Where to Start
Similar to creating signal bots, you should start with training the chat. In this article we focus not on trade logic, but on drawing over the chart.
Important Preparation Rules
To make sure the neural network is trained correctly, it is important to follow a few simple rules.
- Use a completely clean chat
Start with a new dialog with no previous conversation. Old instructions can interfere and ruin the result.
Clean chat = predictable training. - We recommend a paid model version
A basic plan is fine, the main points are:- higher message limit;
- answers are not cut off in the middle;
- large code blocks pass without truncation.
- Send training blocks in full
Any shortening, skipped comments or missing lines of code can cause the neural network to stop drawing lines and zones correctly.
1. Training GPT: Prompt + Bot Skeleton
Training Prompt for the First Code
The prompt you give GPT before inserting the first code:
- I’ll give you code, you need to study it and understand how to correctly draw lines on top of the chart and create fills between lines,
- Also study the code structure for correct implementation of indicators and bots,
- When you write code fixes, updates, or small changes, always return the full updated code,
- In your reply just tell me that you understood everything and wait for further instructions from me,
- Settings in the parameters should always be written in my language in clear words

Code itself:

// ======================== 📊 Trend Signals — EMA Ribbon (price-cross recolor + clean band fill + MACD/ADX arrows) ========================
export const meta = {
  name: "Trend Signals v1.2",
  defaultParams: {
    // ===== EMA =====
    maShortPeriod: 20,
    maLongPeriod: 50,

    // Change color ONLY on real crosses and hold until the next one
    minFlipBars: 1,            // anti-chatter: minimum bars between color flips

    // ===== Fill between EMAs =====
    showBand: true,
    bandFillColor: "#6b7280",  // gray fill (from original)
    bandOpacity: 0.35,

    // ===== EMA colors (both EMAs share the same palette) =====
    shortUpColor:  "#22c55e",
    shortDownColor:"#ef4444",
    longUpColor:   "#22c55e",
    longDownColor: "#ef4444",
    lineWidthShort: 2,
    lineWidthLong:  3,

    // ===== MACD (for arrows) =====
    fastLength: 12,
    slowLength: 26,
    signalLength: 9,

    // ===== ADX/DI (strength filter) =====
    diLen: 14,
    adxLen: 14,
    adxThreshold: 25,

    // ===== Markers =====
    showBuySell: false,        // set true if you want arrows by default
    buyText: "BUY",
    sellText:"SELL",
    buyColor:"#16a34a",
    sellColor:"#ef4444",
    buyTextColor:"#111827",
    sellTextColor:"#111827",
  },
  paramMeta: {
    maShortPeriod:  { label:"Short EMA", type:"number", min:2, max:200 },
    maLongPeriod:   { label:"Long EMA",  type:"number", min:5, max:400 },
    minFlipBars:    { label:"Min bars between recolors", type:"number", min:0, max:10 },

    showBand:       { label:"Show fill", type:"boolean" },
    bandFillColor:  { label:"Fill color", type:"color" },
    bandOpacity:    { label:"Fill opacity", type:"number", min:0, max:1, step:0.05 },

    shortUpColor:   { label:"Short: price above", type:"color" },
    shortDownColor: { label:"Short: price below", type:"color" },
    longUpColor:    { label:"Long: price above",  type:"color" },
    longDownColor:  { label:"Long: price below",  type:"color" },
    lineWidthShort: { label:"Short line width", type:"number", min:1, max:6 },
    lineWidthLong:  { label:"Long line width", type:"number", min:1, max:6 },

    fastLength:     { label:"MACD fast", type:"number", min:2, max:100 },
    slowLength:     { label:"MACD slow", type:"number", min:5, max:300 },
    signalLength:   { label:"MACD signal", type:"number", min:2, max:100 },

    diLen:          { label:"DI period", type:"number", min:2, max:100 },
    adxLen:         { label:"ADX period", type:"number", min:2, max:100 },
    adxThreshold:   { label:"ADX threshold", type:"number", min:5, max:60 },
    showBuySell:    { label:"Show BUY/SELL", type:"boolean" },

    buyText:        { label:"BUY text", type:"text" },
    sellText:       { label:"SELL text", type:"text" },
    buyColor:       { label:"BUY color", type:"color" },
    sellColor:      { label:"SELL color", type:"color" },
    buyTextColor:   { label:"BUY text color", type:"color" },
    sellTextColor:  { label:"SELL text color", type:"color" },
  }
};

export function init(ctx) {
  const { chart, params, LineSeries, candleSeries, createSeriesMarkers } = ctx;

  // ===== math =====
  function ema(src, len){
    const n=src.length; if(!n) return [];
    const out=new Array(n).fill(null); const a=2/(len+1);
    out[0]=src[0]; for(let i=1;i<n;i++) out[i]=a*src[i]+(1-a)*out[i-1];
    return out;
  }
  function rma(src, len){
    const n=src.length; if(!n) return [];
    const out=new Array(n).fill(null);
    out[0]=src[0]; for(let i=1;i<n;i++) out[i]=(out[i-1]*(len-1)+src[i])/len;
    return out;
  }
  function hexToRgba(hex, a){
    const h = hex.replace("#",""), n = parseInt(h.length===3?h.split("").map(c=>c+c).join(""):h,16);
    const r=(n>>16)&255, g=(n>>8)&255, b=n&255; return `rgba(${r},${g},${b},${a})`;
  }

  // Stable “price above/below EMA” state — only flip on real crosses
  function crossState(close, ema, minFlipBars){
    const n=close.length, state=new Array(n).fill(null);
    let i0=0; while(i0<n && !(Number.isFinite(close[i0]) && Number.isFinite(ema[i0]))) i0++;
    if (i0>=n) return state;
    state[i0] = close[i0] >= ema[i0];
    let lastFlip=i0;
    for (let i=i0+1;i<n;i++){
      if (!Number.isFinite(close[i]) || !Number.isFinite(ema[i])) { state[i]=state[i-1]; continue; }
      const prev=close[i-1]-ema[i-1], curr=close[i]-ema[i];
      let s=state[i-1];
      const crossUp   = prev <= 0 && curr > 0;
      const crossDown = prev >= 0 && curr < 0;
      if (crossUp   && (i-lastFlip)>=minFlipBars){ s=true;  lastFlip=i; }
      if (crossDown && (i-lastFlip)>=minFlipBars){ s=false; lastFlip=i; }
      state[i]=s;
    }
    return state;
  }

  // Segment lines (each color section is a separate series)
  function segmentsFromState(times, values, stateBool){
    const upSegs=[], downSegs=[];
    let curr=null;
    for (let i=0;i<values.length;i++){
      const v = values[i], st = stateBool[i];
      if (!Number.isFinite(v) || st==null){ curr=null; continue; }
      if (!curr || curr.type!==st){
        curr = { arr: [], type: st };
        (st ? upSegs : downSegs).push(curr.arr);
        if (i>0 && Number.isFinite(values[i-1]) && stateBool[i-1]!=null && stateBool[i-1]!==st){
          curr.arr.push({ time: times[i-1], value: values[i-1] });
        }
      }
      curr.arr.push({ time: times[i], value: v });
    }
    return { upSegs, downSegs };
  }

  // Segment-series manager
  const segSeries = { shortUp:[], shortDown:[], longUp:[], longDown:[] };
  function ensureSegSeries(bucket, idx, color, width){
    let s = bucket[idx];
    if (!s){
      s = chart.addSeries(LineSeries, {
        color,
        lineWidth: Math.max(1, width|0 || 2),
        lastValueVisible:false,
        priceLineVisible:false,
        crosshairMarkerVisible:false,
      });
      bucket[idx] = s;
    } else {
      s.applyOptions?.({ color, lineWidth: Math.max(1, width|0 || 2) });
    }
    return s;
  }
  function syncSegments(key, color, width, segs){
    const bucket = segSeries[key];
    for (let i=0;i<segs.length;i++){
      const s = ensureSegSeries(bucket, i, color, width);
      s.setData(segs[i]);
    }
    for (let i=segs.length; i<bucket.length; i++){
      const s=bucket[i]; if (s) chart.removeSeries(s);
    }
    bucket.length = segs.length;
  }
  function clearAllSegs(){
    for (const key of Object.keys(segSeries)){
      for (const s of segSeries[key]) if (s) chart.removeSeries(s);
      segSeries[key] = [];
    }
  }

  // ===== Fill between EMAs (polygon without diagonals, split into sections between EMA crosses) =====
  class BandPrimitive {
    constructor(o={}){ this._v = new BandView(o); }
    attached(p){ this._v.attached(p); }
    detached(){ this._v.detached(); }
    paneViews(){ return [this._v]; }
    updateAllViews(){ this._v.update(); }
    setOptions(o){ this._v.setOptions(o); }
    setBand(times, upper, lower, whichUpper){ this._v.setBand(times, upper, lower, whichUpper); }
  }
  class BandView {
    constructor(o){
      this._s=null; this._c=null; this._req=null;
      this._t=[]; this._u=[]; this._l=[]; this._w=[];
      this._o={ fill:"#6b7280", alpha:0.35, ...o };
    }
    attached({series,chart,requestUpdate}){ this._s=series; this._c=chart; this._req=requestUpdate; }
    detached(){ this._s=this._c=this._req=null; }
    update(){}
    zOrder(){ return "bottom"; }
    setOptions(o){ Object.assign(this._o,o); this._req?.(); }
    setBand(t,u,l,w){ this._t=t||[]; this._u=u||[]; this._l=l||[]; this._w=w||[]; this._req?.(); }
    renderer(){
      const self=this;
      const drawImpl=(target)=>{
        const s=self._s,c=self._c; if(!s||!c) return;
        const ts=c.timeScale(); if(!ts) return;
        const o=self._o;
        const draw=(ctx,prX=1,prY=1)=>{
          ctx.save(); ctx.scale(prX,prY);
          ctx.globalAlpha=Math.max(0,Math.min(1,o.alpha));
          ctx.fillStyle=o.fill;

          const N=self._t.length;
          let segU=[], segL=[], prev=null;
          function flush(){
            if (segU.length<2){ segU=[]; segL=[]; return; }
            ctx.beginPath();
            ctx.moveTo(segU[0].x, segU[0].y);
            for (let i=1;i<segU.length;i++) ctx.lineTo(segU[i].x, segU[i].y);
            for (let i=segL.length-1;i>=0;i--) ctx.lineTo(segL[i].x, segL[i].y);
            ctx.closePath(); ctx.fill();
            segU=[]; segL=[];
          }
          for (let i=0;i<N;i++){
            const t=self._t[i], uV=self._u[i], lV=self._l[i], w=self._w[i];
            if (!Number.isFinite(uV)||!Number.isFinite(lV)||w==null){ flush(); prev=null; continue; }
            const x=ts.timeToCoordinate(t), yU=s.priceToCoordinate(uV), yL=s.priceToCoordinate(lV);
            if (x==null||yU==null||yL==null){ flush(); prev=null; continue; }
            if (prev===null) prev=w;
            if (w!==prev){ flush(); prev=w; }
            segU.push({x, y:yU});
            segL.push({x, y:yL});
          }
          flush();
          ctx.restore();
        };
        if (typeof target.useBitmapCoordinateSpace==="function"){
          target.useBitmapCoordinateSpace(sc=>draw(sc.context, sc.horizontalPixelRatio, sc.verticalPixelRatio));
        } else {
          draw(target.context, target.pixelRatio||1, target.pixelRatio||1);
        }
      };
      return { drawBackground: drawImpl, draw: drawImpl };
    }
  }

  let bandPrim = new BandPrimitive({
    fill: hexToRgba(params.bandFillColor, params.bandOpacity ?? 0.35),
    alpha: params.bandOpacity ?? 0.35
  });
  if (typeof candleSeries.attachPrimitive === "function") {
    candleSeries.attachPrimitive(bandPrim);
  } else if (ctx.primitivesApi?.attachPrimitive) {
    ctx.primitivesApi.attachPrimitive(candleSeries, bandPrim);
  } else {
    bandPrim = null; // no primitives — no fill
  }

  // ===== Marker controller: try both APIs =====
  const markerCtrl = (() => {
    let api = null;
    try {
      api = (typeof createSeriesMarkers === "function")
        ? createSeriesMarkers(candleSeries, [])
        : null;
    } catch(_) {}
    return {
      set(list){ try { api?.setMarkers?.(list); } catch(_) {} try { candleSeries.setMarkers?.(list); } catch(_) {} },
      clear(){  try { api?.setMarkers?.([]);   } catch(_) {} try { candleSeries.setMarkers?.([]);   } catch(_) {} },
    };
  })();

  // Quick hook for params change (if runtime calls it)
  function onParamsChanged(next){
    if (!next.showBuySell) markerCtrl.clear(); // instantly hide arrows
  }

  function update(candles){
    const N=candles?.length||0;
    if (N<5){
      clearAllSegs();
      bandPrim?.setBand([],[],[],[]);
      if (!params.showBuySell) markerCtrl.clear();
      return [];
    }

    const times=candles.map(c=>c.time);
    const high =candles.map(c=>c.high);
    const low  =candles.map(c=>c.low);
    const close=candles.map(c=>c.close);

    // ===== EMA
    const sLen=Math.max(2, params.maShortPeriod|0 || 20);
    const lLen=Math.max(3, params.maLongPeriod|0 || 50);
    const emaS=ema(close, sLen);
    const emaL=ema(close, lLen);

    // ===== stable states (recolor only on crosses)
    const minFlip = Math.max(0, params.minFlipBars|0 || 1);
    const stateS = crossState(close, emaS, minFlip);
    const stateL = crossState(close, emaL, minFlip);

    // ===== short/long EMA segments
    const segS = segmentsFromState(times, emaS, stateS);
    const segL = segmentsFromState(times, emaL, stateL);

    syncSegments("shortUp",   params.shortUpColor,   params.lineWidthShort, segS.upSegs);
    syncSegments("shortDown", params.shortDownColor, params.lineWidthShort, segS.downSegs);
    syncSegments("longUp",    params.longUpColor,    params.lineWidthLong,  segL.upSegs);
    syncSegments("longDown",  params.longDownColor,  params.lineWidthLong,  segL.downSegs);

    // ===== fill between EMAs
    if (bandPrim && params.showBand){
      const upper = emaS.map((v,i)=> Math.max(v ?? NaN, emaL[i] ?? NaN));
      const lower = emaS.map((v,i)=> Math.min(v ?? NaN, emaL[i] ?? NaN));
      const whichUpper = emaS.map((v,i)=> (Number.isFinite(v) && Number.isFinite(emaL[i])) ? v>=emaL[i] : null);
      bandPrim.setOptions({
        fill:  hexToRgba(params.bandFillColor, params.bandOpacity ?? 0.35),
        alpha: params.bandOpacity ?? 0.35
      });
      bandPrim.setBand(times, upper, lower, whichUpper);
    } else if (bandPrim){
      bandPrim.setBand([],[],[],[]);
    }

    // ===== BUY/SELL arrows (MACD + ADX)
    if (params.showBuySell){
      const fastMA=ema(close, Math.max(2, params.fastLength|0 || 12));
      const slowMA=ema(close, Math.max(3, params.slowLength|0 || 26));
      const macd  =fastMA.map((v,i)=> (v ?? 0) - (slowMA[i] ?? 0));
      const signal=ema(macd, Math.max(2, params.signalLength|0 || 9));

      const tr=new Array(N).fill(0);
      for (let i=1;i<N;i++){
        const v1=high[i]-low[i], v2=Math.abs(high[i]-close[i-1]), v3=Math.abs(low[i]-close[i-1]);
        tr[i]=Math.max(v1,v2,v3);
      }
      const plusDM=new Array(N).fill(0), minusDM=new Array(N).fill(0);
      for (let i=1;i<N;i++){
        const d=close[i]-close[i-1];
        plusDM[i]=(d>0 && d>-d)? d:0;
        minusDM[i]=(-d>0 && -d>d)? -d:0;
      }
      const diLen = Math.max(2, params.diLen|0 || 14);
      const adxLen= Math.max(2, params.adxLen|0 || 14);
      const atrR  = rma(tr, diLen);
      const plusR = rma(plusDM, diLen);
      const minusR= rma(minusDM, diLen);
      const plusDI = plusR.map((v,i)=> 100 * (v ?? 0) / ((atrR[i] ?? 0) || 1));
      const minusDI= minusR.map((v,i)=> 100 * (v ?? 0) / ((atrR[i] ?? 0) || 1));
      const sumDI  = plusDI.map((_,i)=> (plusDI[i] + minusDI[i]) || 1);
      const diff   = plusDI.map((_,i)=> Math.abs(plusDI[i]-minusDI[i]) / sumDI[i]);
      const adxArr = rma(diff, adxLen).map(v=> 100*(v ?? 0));

      const thr = Number(params.adxThreshold ?? 25);
      const markers = [];
      for (let i=1;i<N;i++){
        const crossUp   = macd[i] >  signal[i] && macd[i-1] <= signal[i-1] && macd[i-1] < 0;
        const crossDown = signal[i] > macd[i]   && signal[i-1] <= macd[i-1] && macd[i-1] > 0;

        if (adxArr[i] > thr && crossUp){
          markers.push({ name:"buy", time:times[i], position:"belowBar", shape:"arrowUp",
            color:params.buyColor, price:low[i], text:params.buyText, textColor:params.buyTextColor });
        }
        if (adxArr[i] > thr && crossDown){
          markers.push({ name:"sell", time:times[i], position:"aboveBar", shape:"arrowDown",
            color:params.sellColor, price:high[i], text:params.sellText, textColor:params.sellTextColor });
        }
      }
      markerCtrl.set(markers);
    } else {
      markerCtrl.clear();
    }

    return [];
  }

  function destroy(){
    clearAllSegs();
    try{
      bandPrim?.setBand([],[],[],[]);
      if (typeof candleSeries.detachPrimitive === "function") candleSeries.detachPrimitive(bandPrim);
      else if (typeof candleSeries.removePrimitive === "function") candleSeries.removePrimitive(bandPrim);
    }catch(_){}
    markerCtrl.clear();
  }

  return { update, destroy, onParamsChanged };
}
2. Second Code: Horizontal Lines and Filled Blocks
After the first training code, you need to send the second block that is responsible for building horizontal levels and zones. At this step, the neural network learns to draw:
- support and resistance areas;
- rectangular zones with fill;
- zone statuses (live, tested, broken);
- visual BUY and SELL signals from these zones.
Prompt text for the second code:
- Here is the second code, learn how to correctly draw horizontal lines and horizontal blocks with fill,
- Just study the code and confirm that you understood and accepted it, then wait for my instructions with my requirements for creating new tools

Code itself:

export const meta = {
  name: "Support & Resistance Signals",
  defaultParams: {
    // ======= 🎯 SIGNALS =======
    signalsEnabled: true,           // 🔕 Signals: On/Off
    mode: "Bounce",                 // "Bounce" | "Breakout" | "Retest"
    signalFilter: "Simple",         // "Simple" | "Filtered"
    bufferAtr: 0.20,                // ×ATR — buffer for events/confirmations

    // — Signal behavior —
    minLevelAgeBars: 1,             // Level age (bars) before first signal
    firstTouchOnly: true,           // First touch only
    reentryAwayAtr: 0.00,           // Re-entry: move away ≥ ×ATR (0=off)
    confirmOverMid: false,          // For “Simple”: require close beyond zone midpoint
    confirmBufferAtr: 0.15,         // Midpoint buffer (×ATR)

    // ======= 🧱 LEVELS =======
    method: "By wicks",             // "By wicks" | "By bodies"
    leftBars: 5,                    // L — pivot on the left
    rightBars: 3,                   // R — confirmation on the right
    // Equality tolerance for pivots (almost equal High/Low do not break confirmation)
    eqTolMode: "×ATR",              // "×ATR" | "Points"
    eqTolAtr: 0.04,                 // ×ATR (if ×ATR mode)
    eqTolPoints: 0,                 // points (if Points mode)

    thicknessMode: "Auto",          // "Auto" | "Points"
    zoneAtrMult: 0.30,              // ×ATR (auto thickness)
    thicknessPoints: 0,             // points (for “Points”)
    zoneMinPoints: 0,               // min thickness (points)
    mergeEnabled: true,             // merge nearby levels

    // ======= ⛔ EVENTS/EXTENSION =======
    keepUntilBreak: true,           // 📌 Do not delete until break (keep after touches)
    stopOn: "Both",                 // if keepUntilBreak=false: "Touch" | "Break" | "Both"
    expiryBars: 3,                  // expiration of “raw” zones (when keepUntilBreak=false)
    preSignals: true,               // pre-signals (logic before close)

    // ======= ⚙️ PRO SETTINGS =======
    lookbackBars: 1000,
    atrPeriod: 14,
    minImpulseAtr: 0.0,             // min impulse after swing (×ATR), 0=off
    mergeTolAtr: 0.25,
    mergeTimeGap: 10,
    touchBy: "Wicks",               // "Wicks" | "Close"
    breakBy: "Close",               // "Close" | "Wicks"
    minVolAtr: 0.0,
    cooldownBars: 2,
    minDistanceOppAtr: 0.7,
    maxLevels: 40,
    maxLevelsPerSide: 30,

    // ======= 🎨 ZONE APPEARANCE =======
    fillAlpha: 0.10,
    showBorder: false,
    borderWidth: 1,
    supColor: "#10b981",            // support — green
    resColor: "#f43f5e",            // resistance — red
    mitigatedColor: "#3b82f6",      // tested — blue
    invalidColor: "#9ca3af",        // broken — gray

    // ======= 🏷 MARKERS =======
    buyText: "BUY",
    sellText: "SELL",
    buyColor: "#16a34a",
    sellColor: "#ef4444",
    buyTextColor: "#ffffff",
    sellTextColor: "#ffffff",
    buyShape: "Arrow up",           // "Arrow up" | "Circle" | "Square"
    sellShape: "Arrow down"         // "Arrow down" | "Circle" | "Square"
  },
  paramMeta: {
    // 🎯 Signals
    signalsEnabled:     { label: "🔕 Signals", type: "boolean" },
    mode:               { label: "🎯 Signal mode", type: "select", options: ["Bounce","Breakout","Retest"] },
    signalFilter:       { label: "Signal filter", type: "select", options: ["Simple","Filtered"] },
    bufferAtr:          { label: "Event buffer ×ATR", type: "number", min: 0, max: 2, step: 0.05 },

    minLevelAgeBars:    { label: "Level age (bars)", type: "number", min: 0, max: 20 },
    firstTouchOnly:     { label: "First touch only", type: "boolean" },
    reentryAwayAtr:     { label: "Re-entry: move away ≥ ×ATR", type: "number", min: 0, max: 5, step: 0.05 },
    confirmOverMid:     { label: "Confirm by zone midpoint", type: "boolean" },
    confirmBufferAtr:   { label: "Midpoint buffer ×ATR", type: "number", min: 0, max: 2, step: 0.05 },

    // 🧱 Levels
    method:             { label: "🧱 Zone method", type: "select", options: ["By wicks","By bodies"] },
    leftBars:           { label: "Pivot left (L)", type: "number", min: 1, max: 20 },
    rightBars:          { label: "Confirmation right (R)", type: "number", min: 1, max: 20 },
    eqTolMode:          { label: "🧪 Equality tolerance mode", type: "select", options: ["×ATR","Points"] },
    eqTolAtr:           { label: "Equality tolerance ×ATR", type: "number", min: 0, max: 0.5, step: 0.01 },
    eqTolPoints:        { label: "Equality tolerance (points)", type: "number", min: 0, max: 100000 },

    thicknessMode:      { label: "Zone thickness", type: "select", options: ["Auto","Points"] },
    zoneAtrMult:        { label: "Thickness ×ATR (for Auto)", type: "number", min: 0.05, max: 2, step: 0.05 },
    thicknessPoints:    { label: "Thickness (points)", type: "number", min: 0, max: 100000 },
    zoneMinPoints:      { label: "Min thickness (points)", type: "number", min: 0, max: 100000 },
    mergeEnabled:       { label: "Merge nearby levels", type: "boolean" },

    // ⛔ Events/Extension
    keepUntilBreak:     { label: "📌 Do not delete until break", type: "boolean" },
    stopOn:             { label: "⛔ Stop extending (if “until break” is off)", type: "select", options: ["Touch","Break","Both"] },
    expiryBars:         { label: "⏱ Expiration (bars)", type: "number", min: 1, max: 10 },
    preSignals:         { label: "✨ Pre-signals before close", type: "boolean" },

    // ⚙️ Pro settings
    lookbackBars:       { label: "⚙️ Pro — Scan depth (bars)", type: "number", min: 200, max: 20000 },
    atrPeriod:          { label: "ATR period", type: "number", min: 5, max: 200 },
    minImpulseAtr:      { label: "Min impulse after swing ×ATR", type: "number", min: 0, max: 5, step: 0.05 },
    mergeTolAtr:        { label: "Merge tolerance ×ATR", type: "number", min: 0.05, max: 2, step: 0.05 },
    mergeTimeGap:       { label: "Merge time gap (bars)", type: "number", min: 0, max: 200 },
    touchBy:            { label: "Touch by", type: "select", options: ["Wicks","Close"] },
    breakBy:            { label: "Break by", type: "select", options: ["Close","Wicks"] },
    minVolAtr:          { label: "Min volatility (ATR)", type: "number", min: 0, max: 100000 },
    cooldownBars:       { label: "Zone cooldown (bars)", type: "number", min: 0, max: 50 },
    minDistanceOppAtr:  { label: "Min distance to opposite level ×ATR", type: "number", min: 0, max: 5, step: 0.05 },
    maxLevels:          { label: "Max levels total", type: "number", min: 1, max: 60 },
    maxLevelsPerSide:   { label: "Max zones per side", type: "number", min: 0, max: 60 },

    // 🎨 Appearance
    fillAlpha:          { label: "🎨 Appearance — Fill opacity", type: "number", min: 0.05, max: 1, step: 0.05 },
    showBorder:         { label: "Show border", type: "boolean" },
    borderWidth:        { label: "Border width", type: "number", min: 0, max: 6 },
    supColor:           { label: "Support color", type: "color" },
    resColor:           { label: "Resistance color", type: "color" },
    mitigatedColor:     { label: "Tested color", type: "color" },
    invalidColor:       { label: "Broken color", type: "color" },

    // 🏷 Markers
    buyText:            { label: "🏷 Markers — BUY text", type: "string" },
    sellText:           { label: "SELL text", type: "string" },
    buyColor:           { label: "BUY arrow color", type: "color" },
    sellColor:          { label: "SELL arrow color", type: "color" },
    buyTextColor:       { label: "BUY text color", type: "color" },
    sellTextColor:      { label: "SELL text color", type: "color" },
    buyShape:           { label: "BUY shape", type: "select", options: ["Arrow up","Circle","Square"] },
    sellShape:          { label: "SELL shape", type: "select", options: ["Arrow down","Circle","Square"] }
  }
};

export function init(ctx){
  const { candleSeries, params, createSeriesMarkers } = ctx;
  const markersApi = createSeriesMarkers(candleSeries, []);

  // ===== Primitive for rectangles =====
  class ZonesPrimitive {
    constructor(o={}){ this._v=new View(o); }
    attached(p){ this._v.attached(p); }
    detached(){ this._v.detached(); }
    paneViews(){ return [this._v]; }
    updateAllViews(){ this._v.update(); }
    setOptions(o){ this._v.setOptions(o); }
    setBoxes(list){ this._v.setBoxes(list); }
  }
  class View{
    constructor(o){
      this._s=null; this._c=null; this._req=null;
      this._boxes=[]; this._o={ fillAlpha:.12, showBorder:true, borderWidth:1, ...o };
    }
    attached({series,chart,requestUpdate}){ this._s=series; this._c=chart; this._req=requestUpdate; }
    detached(){ this._s=this._c=this._req=null; }
    update(){} zOrder(){ return "top"; }
    setOptions(o){ Object.assign(this._o,o); this._req?.(); }
    setBoxes(list){ this._boxes = Array.isArray(list)? list : []; this._req?.(); }
    renderer(){
      const self=this;
      const drawImpl=(target)=>{
        const s=self._s, c=self._c; if(!s||!c) return; const ts=c.timeScale(); if(!ts) return;
        const o=self._o;
        const draw=(ctx,prX=1,prY=1)=>{
          ctx.save(); ctx.scale(prX,prY);
          for(const b of self._boxes){
            const x1=ts.timeToCoordinate(b.t1), x2=ts.timeToCoordinate(b.t2);
            const y1=s.priceToCoordinate(b.top), y2=s.priceToCoordinate(b.bot);
            if(x1==null||x2==null||y1==null||y2==null) continue;
            const l=Math.min(x1,x2), r=Math.max(x1,x2);
            const t=Math.min(y1,y2), B=Math.max(y1,y2);
            const w=Math.max(1,r-l), h=Math.max(1,B-t);
            ctx.globalAlpha=Math.max(0,Math.min(1,o.fillAlpha));
            ctx.fillStyle=b.color; ctx.fillRect(l,t,w,h);
            if(o.showBorder && (o.borderWidth|0)>0){
              ctx.globalAlpha=1; ctx.lineWidth=Math.max(1,o.borderWidth|0);
              ctx.strokeStyle=b.color; ctx.strokeRect(l+.5,t+.5,w,h);
            }
          }
          ctx.restore();
        };
        if(typeof target.useBitmapCoordinateSpace==="function"){
          target.useBitmapCoordinateSpace(sc=>draw(sc.context,sc.horizontalPixelRatio,sc.verticalPixelRatio));
        } else draw(target.context,target.pixelRatio||1,target.pixelRatio||1);
      };
      return { drawBackground: drawImpl, draw: drawImpl };
    }
  }
  let prim = new ZonesPrimitive({
    fillAlpha: params.fillAlpha, showBorder: params.showBorder, borderWidth: params.borderWidth
  });
  if(typeof candleSeries.attachPrimitive==="function") candleSeries.attachPrimitive(prim);
  else if(ctx.primitivesApi?.attachPrimitive) ctx.primitivesApi.attachPrimitive(candleSeries, prim);

  // ===== Utils =====
  const clamp=(v,a,b)=>Math.max(a,Math.min(b,v));
  const mapShape=(val,defVal)=>{
    if(val==="Arrow up")   return "arrowUp";
    if(val==="Arrow down") return "arrowDown";
    if(val==="Circle")     return "circle";
    if(val==="Square")     return "square";
    if(["arrowUp","arrowDown","circle","square"].includes(val)) return val;
    return defVal;
  };
  function atrArr(c,L){
    const N=c.length, out=new Array(N).fill(NaN), tr=new Array(N).fill(0);
    if(!N) return out; tr[0]=c[0].high-c[0].low;
    for(let i=1;i<N;i++){
      const a=c[i], b=c[i-1];
      tr[i]=Math.max(a.high-a.low, Math.abs(a.high-b.close), Math.abs(a.low-b.close));
    }
    let s=0; for(let i=0;i<N;i++){ s+=tr[i]; if(i>=L) s-=tr[i-L]; if(i>=L-1) out[i]=s/L; } return out;
  }
  // Pivots with tolerance (strictly L bars on the left and R on the right)
  function isPH_tol(c,i,L,R,tol){ const v=c[i].high;
    for(let k=1;k<=L;k++) if(c[i-k].high >= v - tol) return false;
    for(let k=1;k<=R;k++) if(c[i+k].high >  v + tol) return false;
    return true;
  }
  function isPL_tol(c,i,L,R,tol){ const v=c[i].low;
    for(let k=1;k<=L;k++) if(c[i-k].low  <= v + tol) return false;
    for(let k=1;k<=R;k++) if(c[i+k].low  <  v - tol) return false;
    return true;
  }
  function zoneFromPivot(c,i,side,method,half){
    const bar=c[i];
    if(method==="By bodies"){
      if(side==='resistance'){ const base=Math.max(bar.open,bar.close); return { top:base+half, bot:base-half, mid:base }; }
      const base=Math.min(bar.open,bar.close); return { top:base+half, bot:base-half, mid:base };
    } else {
      if(side==='resistance'){ const base=bar.high; return { top:base+half, bot:base-half, mid:base }; }
      const base=bar.low; return { top:base+half, bot:base-half, mid:base };
    }
  }

  function isTouchAt(c,i,z,cfg){
    if(i<0||i>=c.length) return false; const b=c[i];
    if(cfg.touchBy==="Close") return b.close>=z.bot && b.close<=z.top;
    return b.low<=z.top && b.high>=z.bot;
  }
  function isBreakAt(c,i,z,cfg,atr){
    if(i<0||i>=c.length) return false; const b=c[i];
    const buf=(cfg.bufferAtr||0)*(atr[i]||atr[i-1]||0);
    if(cfg.breakBy==="Close"){
      if(z.side==="support")    return b.close<(z.bot-buf);
      if(z.side==="resistance") return b.close>(z.top+buf);
    } else {
      if(z.side==="support")    return b.low  <(z.bot-buf);
      if(z.side==="resistance") return b.high >(z.top+buf);
    }
    return false;
  }
  function firstEventIndex(c, z, iStart, iEnd, cfg, atr){
    let mit=null, inv=null;
    for(let i=iStart;i<=iEnd;i++){
      if(mit==null && isTouchAt(c,i,z,cfg)) mit=i;
      if(inv==null && isBreakAt(c,i,z,cfg,atr)) inv=i;
      if(mit!=null && inv!=null) break;
    }
    return { mit, inv };
  }
  const midPrice=(z)=> (z.top+z.bot)/2;

  function mergeZones(list,tolPrice,gapBars){
    if(!list.length) return [];
    const arr=list.slice().sort((a,b)=>a.born-b.born);
    const out=[]; let cur=null;
    for(const z of arr){
      if(!cur){ cur={...z}; continue; }
      const sameSide = cur.side===z.side;
      const priceClose = Math.abs(z.mid - cur.mid) <= tolPrice;
      const timeClose  = z.born <= (cur.right ?? cur.born) + gapBars;
      if(sameSide && priceClose && timeClose){
        cur.mid=(cur.mid+z.mid)/2; cur.top=(cur.top+z.top)/2; cur.bot=(cur.bot+z.bot)/2;
        // Anchor on the FRESH extreme so the left edge does not “creep” backward
        cur.anchor = Math.max(cur.anchor, z.anchor);
        cur.born   = Math.max(cur.born, z.born);   // confirmation — also the latest
      } else { out.push(cur); cur={...z}; }
    }
    if(cur) out.push(cur);
    return out;
  }

  function buildZones(candles, atr){
    const N=candles.length, endIdx=N-1;
    const look=Math.max(200, Math.min((params.lookbackBars|0)||1500, N));
    const startIdx=Math.max(5, endIdx - look + 1);
    const atrRef=atr[endIdx] || atr.filter(Number.isFinite).slice(-1)[0] || (candles[endIdx].high - candles[endIdx].low);

    const L=clamp(params.leftBars|0,1,20);
    const R=clamp(params.rightBars|0,1,20);
    const eqTol=(i)=> (params.eqTolMode==="×ATR" ? Math.max(0,params.eqTolAtr||0)*(atr[i]||atrRef)
                                                 : Math.max(0,params.eqTolPoints||0));

    const method=params.method;
    const minImpulse=Math.max(0, params.minImpulseAtr||0);

    const raw=[];
    for(let i=startIdx+L; i<=endIdx-R; i++){
      const tol=eqTol(i);
      const ph = isPH_tol(candles,i,L,R,tol);
      const pl = isPL_tol(candles,i,L,R,tol);

      if(ph){
        const half = Math.max(
          params.thicknessMode==="Auto" ? (params.zoneAtrMult||0.3)*(atr[i]||atrRef)*0.5 : (params.thicknessPoints||0)*0.5,
          (params.zoneMinPoints||0)*0.5
        );
        const z=zoneFromPivot(candles,i,"resistance",method,half);
        const next=Math.min(endIdx,i+3);
        const imp = Math.max(0,(candles[i].high - candles[next].close))/Math.max(1e-9, atr[i]||atrRef);
        if(imp>=minImpulse) raw.push({ side:"resistance", anchor:i, born:i+R, top:z.top, bot:z.bot, mid:z.mid });
      }
      if(pl){
        const half = Math.max(
          params.thicknessMode==="Auto" ? (params.zoneAtrMult||0.3)*(atr[i]||atrRef)*0.5 : (params.thicknessPoints||0)*0.5,
          (params.zoneMinPoints||0)*0.5
        );
        const z=zoneFromPivot(candles,i,"support",method,half);
        const next=Math.min(endIdx,i+3);
        const imp = Math.max(0,(candles[next].close - candles[i].low))/Math.max(1e-9, atr[i]||atrRef);
        if(imp>=minImpulse) raw.push({ side:"support", anchor:i, born:i+R, top:z.top, bot:z.bot, mid:z.mid });
      }
    }

    // merging
    let merged=raw;
    if(params.mergeEnabled){
      const tol=(params.mergeTolAtr||0.25)*atrRef;
      const gap=Math.max(0, params.mergeTimeGap|0);
      merged = mergeZones(raw, tol, gap);
    }
    merged.sort((a,b)=>a.born-b.born);

    // per-side limits
    const sup=merged.filter(z=>z.side==="support");
    const res=merged.filter(z=>z.side==="resistance");
    const cut=(arr)=> (params.maxLevelsPerSide>0 ? arr.slice(-params.maxLevelsPerSide) : arr);
    let zones = cut(sup).concat(cut(res)).sort((a,b)=>a.born-b.born);
    zones = zones.slice(-Math.max(1, params.maxLevels|0));

    // right edge and status
    const cfg={ touchBy: params.touchBy, breakBy: params.breakBy, bufferAtr: (params.signalFilter==="Simple")? 0 : (params.bufferAtr||0) };
    for(const z of zones){
      const start=Math.min(z.born+1, endIdx);
      let right=endIdx;
      const ev = firstEventIndex(candles, z, start, endIdx, cfg, atr);

      if(params.keepUntilBreak){
        // keep until break: extend to now, stop only on break
        if(ev.inv!=null){ right = Math.max(start, ev.inv); }
      } else {
        if(params.stopOn==="Touch" && ev.mit!=null) right=Math.max(start, ev.mit);
        else if(params.stopOn==="Break" && ev.inv!=null) right=Math.max(start, ev.inv);
        else if(params.stopOn==="Both"){
          const stopIdx = (ev.mit==null)? ev.inv : (ev.inv==null? ev.mit : Math.min(ev.mit,ev.inv));
          if(stopIdx!=null) right=Math.max(start, stopIdx);
        }
      }
      z.right = right;
      z.status = (ev.inv!=null && ev.inv<=right) ? -1 : ((ev.mit!=null && ev.mit<=right) ? 1 : 0);
    }

    return { zones, atrRef };
  }

  function drawZones(candles, zones){
    const endIdx=candles.length-1;
    const rects=[];
    for(const z of zones){
      const color = z.status===-1 ? params.invalidColor :
                    z.status=== 1 ? params.mitigatedColor :
                    (z.side==="support" ? params.supColor : params.resColor);
      const t1 = candles[clamp(z.anchor,0,endIdx)].time; // draw FROM extreme
      const t2 = candles[clamp(z.right, 0,endIdx)].time; // extend by logic
      rects.push({ t1, t2, top:z.top, bot:z.bot, color });
    }
    prim.setOptions({ fillAlpha: params.fillAlpha, showBorder: params.showBorder, borderWidth: params.borderWidth });
    prim.setBoxes(rects);
  }

  // ===== Signals =====
  function firstTouchIndex(candles, z, cfg, end){ for(let j=z.born; j<=end; j++) if(isTouchAt(candles,j,z,cfg)) return j; return null; }
  function hasAwaySince(candles, z, i, atr, thr){
    if(thr<=0) return true;
    for(let j=z.born; j<i; j++){
      const a=atr[j]||atr[j-1]||0;
      const d=Math.abs((candles[j].close??candles[j].open) - z.mid);
      if(d >= thr*a && (candles[j].close>z.top || candles[j].close<z.bot)) return true;
    }
    return false;
  }

  function buildSignals(candles, zones, atr){
    if(!params.signalsEnabled) return [];
    const N=candles.length, endIdx=N-1;
    const simple = params.signalFilter==="Simple";
    const cfg = { touchBy: params.touchBy, breakBy: params.breakBy, bufferAtr: simple?0:(params.bufferAtr||0) };
    const markers=[];
    const bySide={ support: zones.filter(z=>z.side==='support'), resistance: zones.filter(z=>z.side==='resistance') };
    const allowOppDistance=(z, aVal)=>{
      if(simple) return true;
      const others = bySide[z.side==='support'?'resistance':'support'];
      if(!others.length) return true;
      const near = others.reduce((m,x)=> (m==null || Math.abs(x.mid-z.mid)<Math.abs(m.mid-z.mid)) ? x : m, null);
      return !near || Math.abs(near.mid-z.mid) >= (Math.max(0,params.minDistanceOppAtr||0)*aVal);
    };

    const cooldown=Math.max(0, params.cooldownBars|0);
    const lastSig=new Map();

    for(const z of zones){
      const start=Math.max(z.born + Math.max(0, params.minLevelAgeBars|0), 0);
      for(let i=start; i<=Math.min(z.right,endIdx); i++){
        const prev=Math.max(0,i-1);
        const a=atr[i]||atr[prev]||0;
        const awayBuf=(params.bufferAtr||0)*a;
        const last=lastSig.get(z) ?? -1;
        if(!simple && last>=0 && i-last<=cooldown) continue;

        if(params.firstTouchOnly){
          const ft = firstTouchIndex(candles, z, cfg, i);
          if(ft==null || (simple ? (i!==ft) : (prev!==ft))) continue;
        }
        if(!hasAwaySince(candles, z, i, atr, Math.max(0, params.reentryAwayAtr||0))) continue;

        if(simple){
          if(params.mode==="Bounce"){
            if(isTouchAt(candles,i,z,cfg)){
              if(params.confirmOverMid){
                const confBuf=(params.confirmBufferAtr||0)*a;
                const needUp   = z.side==="support"    ? (candles[i].close >= (midPrice(z)+confBuf)) : false;
                const needDown = z.side==="resistance" ? (candles[i].close <= (midPrice(z)-confBuf)) : false;
                if(!(needUp||needDown)) continue;
              }
              if(z.side==="support" && allowOppDistance(z,a)){
                markers.push({ name:"buy", time:candles[i].time, position:"belowBar",
                  shape: mapShape(params.buyShape,"arrowUp"), color: params.buyColor,
                  price:candles[i].close, text: params.buyText||"BUY" });
                lastSig.set(z,i);
              } else if(z.side==="resistance" && allowOppDistance(z,a)){
                markers.push({ name:"sell", time:candles[i].time, position:"aboveBar",
                  shape: mapShape(params.sellShape,"arrowDown"), color: params.sellColor,
                  price:candles[i].close, text: params.sellText||"SELL" });
                lastSig.set(z,i);
              }
            }
          } else if(params.mode==="Breakout"){
            if(isBreakAt(candles,i,z,cfg,atr) && allowOppDistance(z,a)){
              if(z.side==="resistance"){
                markers.push({ name:"buy", time:candles[i].time, position:"belowBar",
                  shape: mapShape(params.buyShape,"arrowUp"), color: params.buyColor,
                  price:candles[i].close, text: params.buyText||"BUY" });
              } else {
                markers.push({ name:"sell", time:candles[i].time, position:"aboveBar",
                  shape: mapShape(params.sellShape,"arrowDown"), color: params.sellColor,
                  price:candles[i].close, text: params.sellText||"SELL" });
              }
              lastSig.set(z,i);
            }
          } else if(params.mode==="Retest"){
            let broke=false; for(let j=Math.max(start,i-5); j<i; j++){ if(isBreakAt(candles,j,z,cfg,atr)){ broke=true; break; } }
            if(broke && isTouchAt(candles,i,z,cfg) && allowOppDistance(z,a)){
              if(z.side==="resistance"){
                markers.push({ name:"buy", time:candles[i].time, position:"belowBar",
                  shape: mapShape(params.buyShape,"arrowUp"), color: params.buyColor,
                  price:candles[i].close, text: params.buyText||"BUY" });
              } else {
                markers.push({ name:"sell", time:candles[i].time, position:"aboveBar",
                  shape: mapShape(params.sellShape,"arrowDown"), color: params.sellColor,
                  price:candles[i].close, text: params.sellText||"SELL" });
              }
              lastSig.set(z,i);
            }
          }
          continue;
        }

        // “Filtered” mode
        if(params.mode==="Bounce"){
          if(isTouchAt(candles,prev,z,cfg)){
            if(z.side==="support"){
              if(candles[i].close >= (midPrice(z)+awayBuf) && allowOppDistance(z,a)){
                markers.push({ name:"buy", time:candles[i].time, position:"belowBar",
                  shape: mapShape(params.buyShape,"arrowUp"), color: params.buyColor,
                  price:candles[i].close, text: params.buyText||"BUY" });
                lastSig.set(z,i);
              }
            } else {
              if(candles[i].close <= (midPrice(z)-awayBuf) && allowOppDistance(z,a)){
                markers.push({ name:"sell", time:candles[i].time, position:"aboveBar",
                  shape: mapShape(params.sellShape,"arrowDown"), color: params.sellColor,
                  price:candles[i].close, text: params.sellText||"SELL" });
                lastSig.set(z,i);
              }
            }
          }
        } else if(params.mode==="Breakout"){
          if(isBreakAt(candles,i,z,cfg,atr) && allowOppDistance(z,a)){
            if(z.side==="resistance"){
              markers.push({ name:"buy", time:candles[i].time, position:"belowBar",
                shape: mapShape(params.buyShape,"arrowUp"), color: params.buyColor,
                price:candles[i].close, text: params.buyText||"BUY" });
            } else {
              markers.push({ name:"sell", time:candles[i].time, position:"aboveBar",
                shape: mapShape(params.sellShape,"arrowDown"), color: params.sellColor,
                price:candles[i].close, text: params.sellText||"SELL" });
            }
            lastSig.set(z,i);
          }
        } else if(params.mode==="Retest"){
          const window=3; let brokeUp=false, brokeDn=false, jBreak=-1;
          for(let j=Math.max(start,i-window); j<i; j++){
            if(isBreakAt(candles,j,z,cfg,atr)){ if(z.side==="resistance") brokeUp=true; if(z.side==="support") brokeDn=true; jBreak=j; }
          }
          if(jBreak>=0 && isTouchAt(candles,prev,z,cfg)){
            if(z.side==="resistance" && brokeUp){
              if(candles[i].close >= (midPrice(z)+awayBuf) && allowOppDistance(z,a)){
                markers.push({ name:"buy", time:candles[i].time, position:"belowBar",
                  shape: mapShape(params.buyShape,"arrowUp"), color: params.buyColor,
                  price:candles[i].close, text: params.buyText||"BUY" });
                lastSig.set(z,i);
              }
            } else if(z.side==="support" && brokeDn){
              if(candles[i].close <= (midPrice(z)-awayBuf) && allowOppDistance(z,a)){
                markers.push({ name:"sell", time:candles[i].time, position:"aboveBar",
                  shape: mapShape(params.sellShape,"arrowDown"), color: params.sellColor,
                  price:candles[i].close, text: params.sellText||"SELL" });
                lastSig.set(z,i);
              }
            }
          }
        }
      }
    }
    return markers;
  }

  function update(candles){
    const N=candles?.length||0;
    if(N<50){ prim.setBoxes([]); markersApi.setMarkers([]); return []; }

    const atr = atrArr(candles, Math.max(5, params.atrPeriod|0));
    const atrRef = atr[N-1] || atr.filter(Number.isFinite).slice(-1)[0] || (candles[N-1].high - candles[N-1].low);
    if((params.minVolAtr||0)>0 && atrRef<params.minVolAtr){ prim.setBoxes([]); markersApi.setMarkers([]); return []; }

    const { zones } = buildZones(candles, atr);
    drawZones(candles, zones);

    const markers = buildSignals(candles, zones, atr);
    const mapped = markers.map(m=>({
      ...m,
      text: m.name==='buy' ? (params.buyText||'BUY') : (params.sellText||'SELL'),
      color: m.name==='buy' ? (params.buyColor||'#16a34a') : (params.sellColor||'#ef4444'),
      textColor: m.name==='buy' ? (params.buyTextColor||'#ffffff') : (params.sellTextColor||'#ffffff')
    }));
    markersApi.setMarkers(mapped);
    return mapped;
  }

  function destroy(){
    try{
      prim?.setBoxes([]);
      if(typeof candleSeries.detachPrimitive==="function") candleSeries.detachPrimitive(prim);
      else if(typeof candleSeries.removePrimitive==="function") candleSeries.removePrimitive(prim);
    }catch(_){}
    prim=null; markersApi.setMarkers([]);
  }

  return { update, destroy };
}
After sending this block, GPT should confirm it understood everything and is waiting for the next tasks. At this point, training can be considered complete and you can move on to practical tasks.
What to Do After Training: Give GPT Tasks
Once you have sent both codes into the chat and received confirmation from the model, you can start formulating your own tasks for creating visual tools tailored to your needs.
Example requests:
- Classic two-moving-average indicator
Create a classic visual indicator consisting of two moving averages.
The first line with setting 20, the second with setting 50.
When the lines cross from bottom to top — signal BUY, when crossing from top to bottom — signal SELL. - Classic support and resistance levels
Create classic support and resistance levels without signals.
I only need levels and zones, without BUY and SELL arrows. - KAMA indicator
Create a KAMA indicator for the chart that is drawn on top of price.
Add parameters to configure period and smoothing. - Any other variations
You can combine ideas:- trend lines plus levels;
- filters by trading time;
- visualization of zones where you most often get profitable binary option trades.
Small Checklist:
Create a new chat
Create a new, clean chat with GPT so no old instructions interfere with training.
Send the first training prompt and code
Paste the text with the phrase “Training prompt” and replace “HERE WILL BE THE CODE” with the actual skeleton of the first indicator. Wait for the response that everything is clear.
Send the second code with levels and zones
Paste the text of the second prompt and replace the second placeholder “HERE WILL BE THE CODE” with the skeleton of the support and resistance levels tool.
Formulate your own task
Describe in simple words what visual indicator or tool you need for Spectra Charts and Pocket Option trading. Ask the neural network to output ready-to-use code in full.
It’s Important to Understand the Limitations
- These prompts train the neural network to create graphical indicators that are drawn over the price chart.
- Oscillator-type indicators that usually live in a separate lower pane will NOT be created.
We are talking specifically about visual tools that live on the main candlestick chart.
- support and resistance levels;
- moving averages and trend lines;
- visual entry and exit zones;
- BUY/SELL arrows for binary options.
Example of Visualization on the Chart
This is what the result of the trained GPT and your indicator in Spectra Charts might look like (simple example of levels and a moving average):
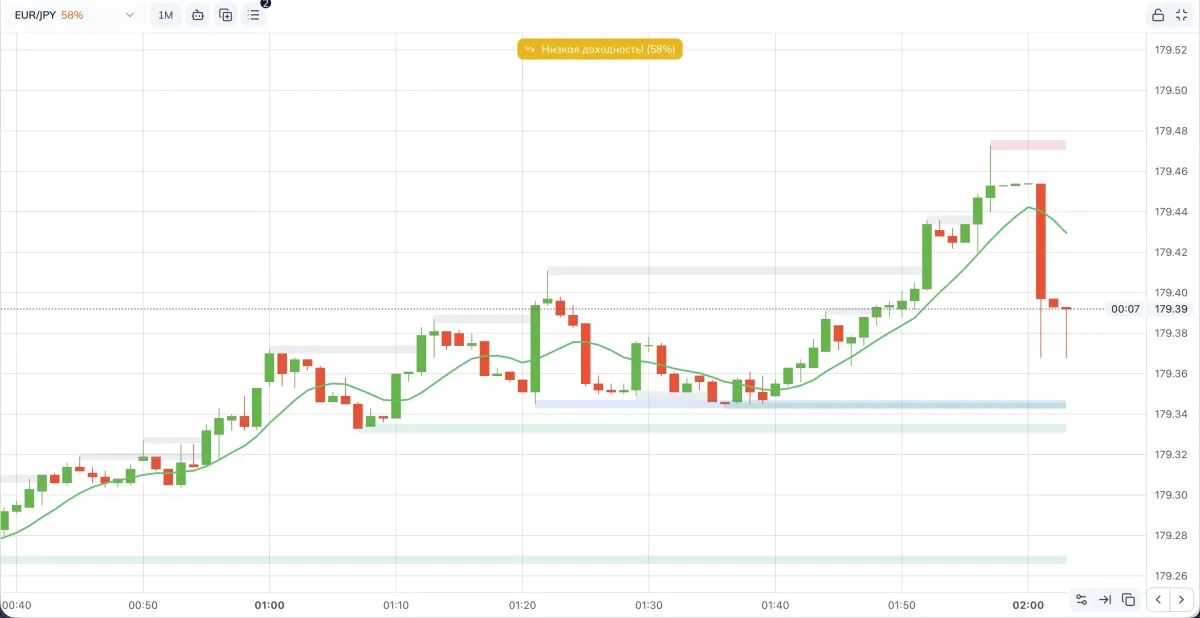
- neat lines and zones on top of the chart;
- clear levels you can use to look for entries;
- visual elements that help you make trade decisions on Pocket Option.
Common Problems and How to Solve Them
So you do not have to guess, let’s collect the typical questions in one block.
- Check that you did not send an incomplete prompt or truncated code. If the training used partial code, the neural network will keep failing.
- If you are sure you sent everything correctly, tell GPT that no lines appeared in Spectra Charts. Describe the problem and ask it to fix the code. The neural network will try to return an updated version.
- If your task is too complex and bulky, try to simplify the description and move in smaller steps.
- If nothing helps, create a new chat, repeat the two-block training and only then ask again to generate an indicator.
- Copy the error text from the Spectra Charts interface.
- Paste this error into the chat with GPT and ask it to find and fix the problem in the code.
- After that, replace the old code with the new version suggested by the neural network and test again.
- Describe in the simplest possible words what exactly you want to change. For example: change line colors, widen zones, add a trading session time filter, or tighten the conditions for a BUY signal.
- Ask GPT to return the full updated code, not fragments.
- Replace the old version in Spectra Charts with the new code and test it on the binary-options trade history.
Summary
- You train GPT on two code skeletons that show how to draw lines, zones, and signals directly on the Spectra Charts graph.
- After that, you can formulate any tasks for creating visual tools under your strategies on Pocket Option and other binary-options platforms.
- Even if you are just starting and do not understand programming very well, proper work with prompts lets you offload 99% of the heavy lifting to the neural network and focus on the strategy, risk management, and selecting high-quality signals.
Creating Oscillators for Spectra Charts in a Separate Panel Below the Price
A step-by-step guide on how to train GPT to create oscillators in the lower panel of Spectra Charts and use them for binary-options trading on Pocket Option.
Creating a signal bot in Spectra Charts with BUY and SELL labels
Step-by-step guide: how to train ChatGPT, insert a ready-made bot skeleton with visual analytics, write signal logic, and create BUY/SELL labels in Spectra Charts.