Creating Oscillators for Spectra Charts in a Separate Panel Below the Price
Creating a Visual Tool for Spectra Charts with Lines Rendered Below the Price Chart
This is the third instructional post in our series on creating custom indicators and visual tools in Spectra Charts. In the previous materials, we covered:
- how to create signal bots with BUY and SELL labels;
- how to build visual tools on top of the chart — trendlines, zones, and support/resistance levels.
In this material, you’ll learn how to correctly create oscillators displayed in a separate panel under the main price chart in Spectra Charts. These indicators are especially useful when trading binary options, where it’s important to see not only the price but also its “momentum” — acceleration, slowdown, overbought and oversold conditions.
What an Oscillator Is — in Simple Words
An oscillator is a standalone indicator located below the main price chart, which:
- moves up and down within a specific range;
- helps evaluate the strength of price movement;
- often highlights moments when the market is “overheated” and ready for a correction.
Examples of oscillators:
- Momentum — shows how quickly the price is rising or falling.
- Various MACD, RSI, and other classical indicators — but in our case, represented as custom Spectra Charts tools.
- Do not confuse an oscillator in a separate panel with indicators drawn on top of the chart, as in the previous post.
- An oscillator always lives in a separate pane under the main chart and never overlays candles or interferes with reading price.
Where to Start
As with the previous posts, the key is training the neural network. This is extremely easy: you only need to copy one prompt, and you’ll get a fully trained chat capable of creating any oscillator-indicators for the lower panel.
You may train the same chat with all capabilities at once:
- Signals (signal bots).
- Creation of visual lines and zones on top of the chart.
- Creation of oscillators in the lower panel.
The main requirement is to send the training prompt in full, without trimming or missing pieces. This ensures GPT understands the code structure and can generate correct oscillators for your tasks.
1. The Training Prompt for Creating Code
This prompt is the foundation. You give it to GPT once, and after that, the chat becomes “trained” to build oscillators for Spectra Charts.
Here is the prompt you send to GPT before inserting your first code:
- I’m giving you code; you must study it and understand how to correctly draw oscillators (indicators) in a separate panel below the price chart.
- Also study the code structure to understand the proper format of Spectra Charts indicators.
- When you write code fixes, updates, or minor adjustments, always return the **full** code, not fragments.
- In your response, confirm that you understood everything and wait for my next commands.
- In the parameters section, always use **natural language labels** (clear and human-readable).
- Training code:
// =========================== Phantom Wave Oscillator ===========================
// Oscillator in a separate pane. Based on a WaveTrend-style algorithm:
//  AP  = source (default HLC3)
//  ESA = EMA(AP, channelLength)
//  DEV = EMA(|AP - ESA|, channelLength)
//  CI  = (AP - ESA) / (0.015 * DEV)
//  PWO = EMA(CI, averageLength) — main line
//  SIG = EMA(PWO, signalLength) — signal line
//  HIST = PWO - SIG — histogram
//
// Hover values: all series must always return a value (0 before “warm-up”).
// Rendering: lines + histogram + zero line + +L / –L levels.

export const meta = {
  name: "Phantom Wave Oscillator",
  pane: "separate",
  defaultParams: {
    // === Values (top) ===
    source: "HLC3",         // Close | HL2 | HLC3
    channelLength: 10,      // ESA/DEV period
    averageLength: 21,      // EMA smoothing period for CI
    signalLength: 4,        // signal EMA period
    levelUp: 60,            // upper level
    levelDown: -60,         // lower level

    // === Appearance (bottom, grouped) ===
    // Main line
    showMain: true,
    mainColor: "#06b6d4",
    mainWidth: 2,

    // Signal line
    showSignal: true,
    signalColor: "#f59e0b",
    signalWidth: 2,

    // Histogram
    showHist: true,
    histUpColor: "#22c55e",
    histDownColor: "#ef4444",
    histWidth: 2,

    // Zero line
    showZero: true,
    zeroColor: "#6b7280",
    zeroWidth: 1,
    zeroStyle: "dashed", // dashed | solid

    // Levels
    showLevelUp: true,
    levelUpColor: "#a855f7",
    levelUpWidth: 1,
    showLevelDown: true,
    levelDownColor: "#a855f7",
    levelDownWidth: 1
  },
  paramMeta: {
    // === Values ===
    source: {
      label: "Source",
      type: "select",
      options: [
        { label: "Close", value: "Close" },
        { label: "HL2 (H+L)/2", value: "HL2" },
        { label: "HLC3 (H+L+C)/3", value: "HLC3" }
      ]
    },
    channelLength: { label: "Channel length (ESA/DEV)", type: "number", min: 2, max: 300 },
    averageLength: { label: "Smoothing period (EMA)",   type: "number", min: 2, max: 300 },
    signalLength:  { label: "Signal period (EMA)",      type: "number", min: 1, max: 300 },
    levelUp:       { label: "Level +L",                 type: "number", min: -2000, max: 2000, step: 1 },
    levelDown:     { label: "Level −L",                 type: "number", min: -2000, max: 2000, step: 1 },

    // === Appearance ===
    showMain:    { label: "Main line", type: "boolean" },
    mainColor:   { label: "Main color", type: "color" },
    mainWidth:   { label: "Main width (px)", type: "number", min: 1, max: 5 },

    showSignal:  { label: "Signal line", type: "boolean" },
    signalColor: { label: "Signal color", type: "color" },
    signalWidth: { label: "Signal width (px)", type: "number", min: 1, max: 5 },

    showHist:      { label: "Histogram", type: "boolean" },
    histUpColor:   { label: "Histogram >0 color", type: "color" },
    histDownColor: { label: "Histogram <0 color", type: "color" },
    histWidth:     { label: "Histogram width (px)", type: "number", min: 1, max: 5 },

    showZero:   { label: "Zero line", type: "boolean" },
    zeroColor:  { label: "Zero line color", type: "color" },
    zeroWidth:  { label: "Zero width (px)", type: "number", min: 1, max: 5 },
    zeroStyle:  { label: "Zero line style", type: "select", options: [
      { label: "Dashed", value: "dashed" },
      { label: "Solid",  value: "solid" }
    ]},

    showLevelUp:   { label: "Show +L", type: "boolean" },
    levelUpColor:  { label: "Color +L", type: "color" },
    levelUpWidth:  { label: "Width +L (px)", type: "number", min: 1, max: 5 },

    showLevelDown: { label: "Show −L", type: "boolean" },
    levelDownColor:{ label: "Color −L", type: "color" },
    levelDownWidth:{ label: "Width −L (px)", type: "number", min: 1, max: 5 }
  }
};

export function init(ctx) {
  const { chart, addSeries, LineSeries, HistogramSeries, paneIndex, params } = ctx;

  // ==== Series (shared scale) ====
  const scaleId = "right";
  const main = addSeries(LineSeries, { priceScaleId: scaleId, lineWidth: 2, priceLineVisible: false, lastValueVisible: false }, paneIndex);
  const signal = addSeries(LineSeries, { priceScaleId: scaleId, lineWidth: 2, priceLineVisible: false, lastValueVisible: false }, paneIndex);
  const hist = addSeries(HistogramSeries, { priceScaleId: scaleId, base: 0, priceLineVisible: false }, paneIndex);
  const zero = addSeries(LineSeries, { priceScaleId: scaleId, lineWidth: 1, priceLineVisible: false, lastValueVisible: false }, paneIndex);
  const lvlUp = addSeries(LineSeries, { priceScaleId: scaleId, lineWidth: 1, priceLineVisible: false, lastValueVisible: false }, paneIndex);
  const lvlDn = addSeries(LineSeries, { priceScaleId: scaleId, lineWidth: 1, priceLineVisible: false, lastValueVisible: false }, paneIndex);

  // ==== Utils ====
  const clamp = (v, lo, hi) => Math.max(lo, Math.min(hi, v));
  const clampW = (v, d = 1) => { const n = Number(v); return Math.max(1, Math.min(5, Number.isFinite(n) ? Math.round(n) : d)); };

  function pickPrecision(sample) {
    if (!Number.isFinite(sample) || sample === 0) return 5;
    const v = Math.abs(sample);
    if (v >= 100) return 2;
    if (v >= 10)  return 3;
    if (v >= 1)   return 4;
    if (v >= 0.1) return 5;
    return 6;
  }

  function EMA(src, len) {
    const n = src.length, out = new Array(n).fill(undefined);
    if (!n || len <= 0) return out;
    const a = 2 / (len + 1);
    let v = src[0];
    out[0] = v;
    for (let i = 1; i < n; i++) { v = a * src[i] + (1 - a) * v; out[i] = v; }
    return out;
  }

  // Main calculation
  function calcPWO(candles, srcType, chLen, avgLen, sigLen) {
    const n = candles.length; if (!n) return { t: [], pwo: [], sig: [], hist: [] };
    const t = candles.map(c => c.time);

    let src;
    switch (srcType) {
      case "Close": src = candles.map(c => c.close); break;
      case "HL2":   src = candles.map(c => (c.high + c.low) / 2); break;
      default:      src = candles.map(c => (c.high + c.low + c.close) / 3); // HLC3
    }

    // ESA & DEV
    const esa = EMA(src, chLen);
    const absDiff = src.map((v, i) => Math.abs(v - (esa[i] ?? v)));
    const dev = EMA(absDiff, chLen).map(v => (v && v !== 0) ? v : 1e-12);

    // CI → PWO → SIG
    const ci = src.map((v, i) => (v - (esa[i] ?? v)) / (0.015 * dev[i]));
    const pwo = EMA(ci, avgLen);
    const sig = EMA(pwo.map(v => Number.isFinite(v) ? v : 0), sigLen);

    // HIST
    const hist = pwo.map((v, i) => (Number.isFinite(v) && Number.isFinite(sig[i])) ? (v - sig[i]) : 0);

    // Pre-fill with zeros for hover values
    const safe = arr => arr.map(v => Number.isFinite(v) ? v : 0);

    return { t, pwo: safe(pwo), sig: safe(sig), hist: safe(hist) };
  }

  function update(candles) {
    if (!candles || candles.length === 0) {
      main.setData([]); signal.setData([]); hist.setData([]); zero.setData([]); lvlUp.setData([]); lvlDn.setData([]);
      return [];
    }

    // === Params ===
    const srcType = (params.source === "Close" || params.source === "HL2" || params.source === "HLC3") ? params.source : "HLC3";
    const chLen = Math.max(2, +params.channelLength || 10);
    const avgLen = Math.max(2, +params.averageLength || 21);
    const sigLen = Math.max(1, +params.signalLength || 4);
    const Lup = Number(params.levelUp ?? 60);
    const Ldn = Number(params.levelDown ?? -60);

    const { t, pwo, sig, hist: H } = calcPWO(candles, srcType, chLen, avgLen, sigLen);

    // Scale format
    const last = pwo.length ? pwo[pwo.length - 1] : 0;
    const prec = pickPrecision(last);
    const minMove = Math.pow(10, -prec);

    for (const s of [main, signal, hist, zero, lvlUp, lvlDn]) {
      s.applyOptions?.({ priceFormat: { type: "price", precision: prec, minMove } });
    }

    // Data
    const mainData = t.map((time, i) => ({ time, value: pwo[i] }));
    const signalData = t.map((time, i) => ({ time, value: sig[i] }));
    const zeroData = t.map(time => ({ time, value: 0 }));
    const upData = t.map(time => ({ time, value: Lup }));
    const dnData = t.map(time => ({ time, value: Ldn }));

    const histUpColor = params.histUpColor || "#22c55e";
    const histDownColor = params.histDownColor || "#ef4444";

    const histData = t.map((time, i) => ({
      time,
      value: H[i],
      color: (H[i] >= 0) ? histUpColor : histDownColor
    }));

    // Apply options / visibility
    main.applyOptions({
      visible: params.showMain !== false,
      color: params.mainColor || "#06b6d4",
      lineWidth: clampW(params.mainWidth, 2)
    });
    main.setData(params.showMain !== false ? mainData : []);

    signal.applyOptions({
      visible: params.showSignal !== false,
      color: params.signalColor || "#f59e0b",
      lineWidth: clampW(params.signalWidth, 2)
    });
    signal.setData(params.showSignal !== false ? signalData : []);

    hist.applyOptions({
      visible: params.showHist !== false,
      color: histUpColor,
      lineWidth: clampW(params.histWidth, 2)
    });
    hist.setData(params.showHist !== false ? histData : []);

    zero.applyOptions({
      visible: params.showZero !== false,
      color: params.zeroColor || "#6b7280",
      lineWidth: clampW(params.zeroWidth, 1),
      lineStyle: (params.zeroStyle === "solid") ? 0 : 1
    });
    zero.setData(params.showZero !== false ? zeroData : []);

    lvlUp.applyOptions({
      visible: params.showLevelUp !== false,
      color: params.levelUpColor || "#a855f7",
      lineWidth: clampW(params.levelUpWidth, 1)
    });
    lvlUp.setData(params.showLevelUp !== false ? upData : []);

    lvlDn.applyOptions({
      visible: params.showLevelDown !== false,
      color: params.levelDownColor || "#a855f7",
      lineWidth: clampW(params.levelDownWidth, 1)
    });
    lvlDn.setData(params.showLevelDown !== false ? dnData : []);

    return []; // no markers
  }

  function destroy() {
    try { chart.removeSeries(main); } catch (_) {}
    try { chart.removeSeries(signal); } catch (_) {}
    try { chart.removeSeries(hist); } catch (_) {}
    try { chart.removeSeries(zero); } catch (_) {}
    try { chart.removeSeries(lvlUp); } catch (_) {}
    try { chart.removeSeries(lvlDn); } catch (_) {}
  }

  return { update, destroy };
}
What happens after sending this block:
- GPT learns the code structure and “understands” how to:
- attach an oscillator to a separate pane under the chart;
- define parameters using clear natural-language labels;
- update and fully clean up the indicator;
- After that, you can ask it to generate new oscillators based on this template.
2. After Training: giving GPT your tasks
Once you’ve sent the training prompt and GPT confirmed that it understands everything and is waiting for commands, you can begin formulating your own tasks for creating visual tools under the chart.
- Create a classic Momentum indicator.
- Create a combined Momentum + MACD panel.
- Any other variations.
Let’s expand these with more detail:
- Simple Momentum
You can write:
“Create a classic Momentum indicator in the lower panel below the chart. Add a period parameter, display the momentum line, and highlight the zero line for clarity.” - Momentum + MACD Combo
Your request may look like:
“Create an oscillator where the momentum line and histogram are displayed in one panel together with the MACD indicator. Make the parameters in plain Russian so I can adjust the momentum period and MACD settings.” - Custom variations
Everything is limited only by your ideas. The key is to describe:- which lines you want to display;
- which levels you need;
- whether anything should be highlighted with colors;
- how the indicator should be used in binary-options trading (filtering signals, spotting reversals, etc.).
Feel free to describe everything in your own words — there’s no need for fancy terminology. The neural network just needs clear conditions.
Example of How Oscillators Look on the Chart
To help you visualize the final result, here’s an example of what oscillators in Spectra Charts may look like:
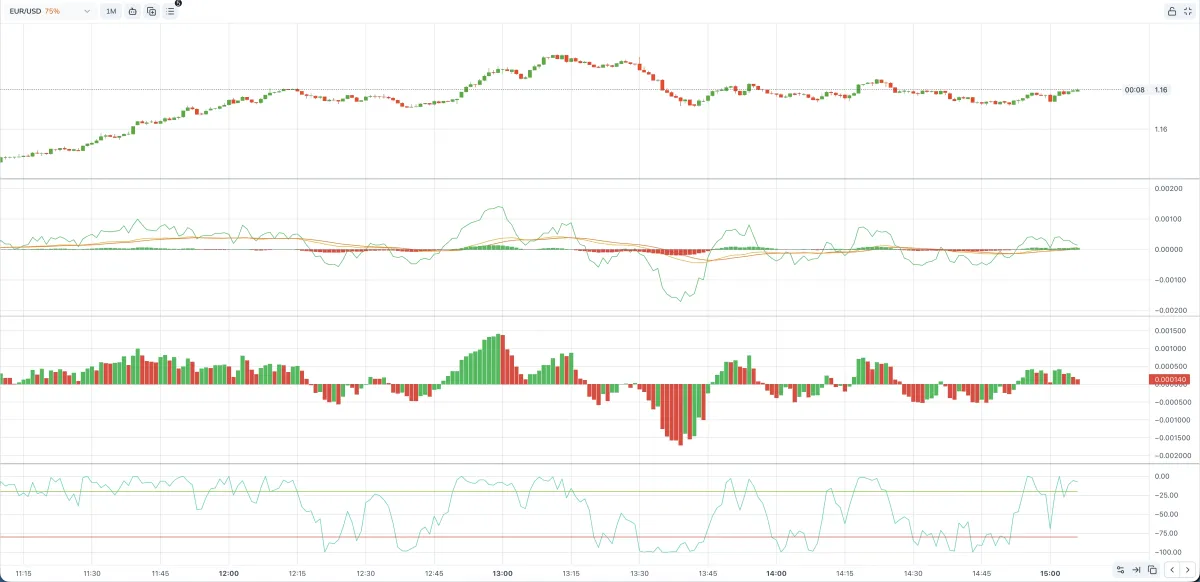
In a single lower pane, you can:
- place one or multiple lines;
- add levels (for example, overbought/oversold zones);
- visually separate calm market phases from high-momentum impulses.
For a trader, this becomes a powerful instrument: you don’t just see the raw chart — you also see actionable clues about when to be cautious or when to search for entries.
How to Write a Proper Prompt for the Neural Network
There is one important idea you must understand: You can create nearly any tool you want — but the result fully depends on how correctly you describe the task.
- If the prompt is vague, GPT will guess the missing details and may rewrite the logic based on its own assumptions.
- Extremely complex or exotic constructions may be implemented incorrectly.
For such tools, deeper training or additional examples may be necessary — beyond the scope of this guide.
How to Improve Quality of Results
To increase your chances of getting a functional, understandable indicator, follow these simple rules:
Describe the goal, not just the formula
- Don’t stop at “make an oscillator”.
- Better example:
“I need an indicator that shows price acceleration over the last N candles and filters out weak movements.”
Specify the visual appearance immediately
Explain where the indicator should be placed and what it should look like:
- which panel it belongs to (lower panel under the chart);
- which lines and colors you want;
- whether you need levels, labels, or shaded regions.
Ask for the full code
- This makes it easier to paste the indicator into Spectra Charts and test it with no manual stitching.
- Example request:
“Give me the full code of the indicator so I can paste it directly into Spectra Charts.”
Save successful code versions
- If GPT produces a clean and working indicator, save it separately.
- After that, you can request:
“Take this code and improve it according to these rules,”
instead of generating everything from scratch.
Possible Issues and Important Details
Finally, let’s discuss common situations you may face — and how to solve them quickly through GPT.
1. Oscillators not fully removed
Visual elements remain on screen, and the page needs to be refreshed.
To avoid this, you must explicitly tell the neural network to fix the cleanup logic.
Recommended phrasing (only if the issue has appeared):
“Ensure that when the indicator is disabled, all lines, objects, and data are fully removed. Nothing should stay on the chart, so I don’t have to refresh the page.”
2. Errors in logic or rendering
An indicator may behave strangely:
- it doesn’t appear at all;
- it draws in the wrong place;
- values are nonsensical or excessively large.
What to do:
- Make sure the code wasn’t truncated when copying/pasting.
- If Spectra Charts shows an error, copy the full error message.
- Send it to GPT with a clear instruction, e.g.:
“Analyze this error and fix the indicator. Return the fully corrected version.”
This gives the neural network a solid reference point, helping it fix the real cause rather than rewriting the indicator from scratch.
This was the third educational guide on creating visual tools using Spectra Charts.
If you have any questions or difficulties implementing your indicators, feel free to contact our support bot: https://t.me/pocketservice111
or our partner chat “Mnogo Deneg Trade”.
How to register on the Pocket Option exchange
Step-by-step guide to creating a new account: Pocket Option account registration, identity verification, and getting started with binary options trading.
Creating a Visual Tool for Spectra Charts with Line Drawing on the Chart
Step-by-step guide on how to teach GPT to draw lines and zones in Spectra Charts and use it when trading binary options on Pocket Option.