Trading Bot Fractal Edge Breakout — breakout of fractal edges
What is Fractal Edge Breakout
Fractal Edge Breakout is an approach to entering on the breakout of the nearest meaningful edge of price. The edges come from fractals (local highs/lows), the direction is confirmed by the EMA slope, and the validity of the breakout — by an ATR-based buffer.
The idea is simple: the market often tests local peaks/troughs; when the close goes beyond the edge + a small allowance, the probability of continuation is higher than with a mere touch without allowance.
- A classic fractal is a five-candle pattern: for an upper fractal the central High is above the two neighbors on the left and right; for a lower fractal the central Low is below its neighbors. These points are convenient to use as local resistance/support levels.
How the edge breakout idea works
- Level: an upper fractal provides local resistance (FH — high), a lower one provides support (FL — low).
- Direction: filter by the EMA slope (current value above/below the previous one).
- Confirmation: require the close beyond the level by ATR × multiplier to filter out “taps.”
- Trade: after confirmation, wait for the next candle and enter in the breakout direction.
How it’s implemented in our bot
- For each bar, the presence of an upper/lower fractal is determined.
- Within the K window, the extreme meaningful ones are chosen: the highest FH and the lowest FL.
- EMA and ATR are calculated with the specified periods.
- The EMA slope is checked (up for BUY, down for SELL).
- A candle “quality” filter: the body share to the full range must be ≥ the specified threshold.
- BUY: close above
FH + ATR × multiplier. SELL: belowFL − ATR × multiplier. - Markers are placed on the chart: arrows and BUY/SELL text with the chosen colors.
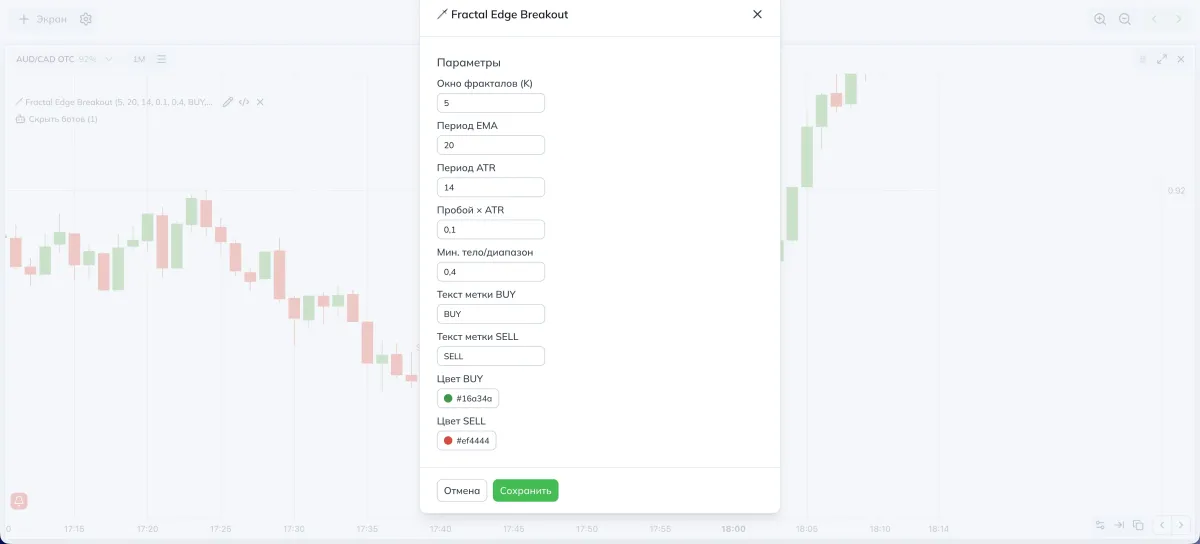
Parameters and their effect on behavior
| Parameter (as in settings) | Purpose | If you decrease | If you increase |
|---|---|---|---|
| Fractal window (K) | How many recent bars we consider when picking FH/FL | Levels are “fresher,” more signals | Levels are “stronger,” fewer signals |
| EMA period | Sets slope sensitivity | More flips, more signals | Smoother slope, fewer signals |
| ATR period | Basis for the breakout buffer | Buffer is more responsive to the market | Buffer is more stable |
| Breakout × ATR | Minimum allowance beyond the level | Lower threshold, more signals, more noisy ones | Higher threshold, fewer but cleaner |
| Min. body/range | Requirement for a “confident” candle | We allow weak bodies, more signals | We require strong bodies, fewer, cleaner |
| BUY/SELL label text | Text on arrows | — | — |
| BUY/SELL color | Marker styling | — | — |
- Want more signals? Lower K, Breakout × ATR, and Min. body/range, slightly reduce the EMA period.
- Want fewer but more accurate? Raise K, Breakout × ATR, and Min. body/range, increase the EMA period.
Parameter recommendations
- Fractal window (K): 5–7
- EMA: 20
- ATR: 14
- Breakout × ATR: 0.10–0.15
- Min. body/range: 0.40–0.50
- If there are few signals: first reduce K and Breakout × ATR in small steps.
- K: 7–9
- Breakout × ATR: 0.15–0.20
- Why: to filter out typical “taps” around news.
Filter combinations
- Trend-only: EMA slope conditions are already built in; you can strengthen the filter by increasing Breakout × ATR.
- Thin hours: don’t understate Min. body/range — weak candles tend to retrace more often.
- Fast OTC profile: reduce K and EMA, but offset it with a slightly higher Breakout × ATR.
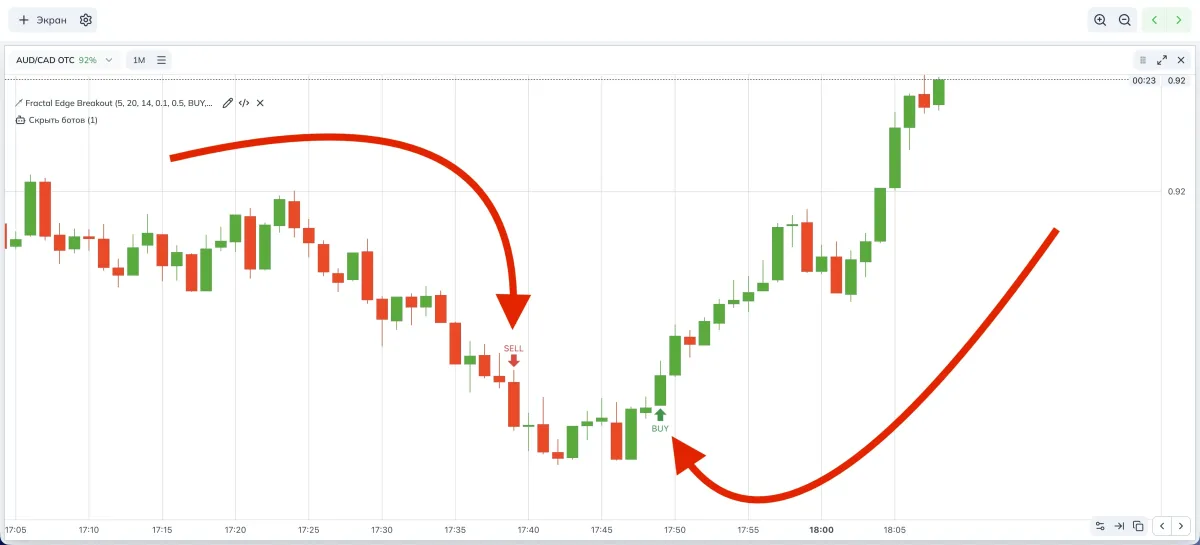
Where to see signals in Spectra Charts
Open the selected asset on Pocket Option in Spectra Charts.
Connect Fractal Edge Breakout.
Choose your working timeframe (1 minute is convenient to start).
BUY/SELL markers will appear on the chart where a breakout is confirmed.
Trading plan
Preparation
Pocket Option asset in Spectra Charts, OTC or real market mode, 1-minute timeframe.
BUY signal
EMA slope up; FH found within K; close above FH + ATR × multiplier; body ≥ threshold.
SELL signal
EMA slope down; FL found within K; close below FL − ATR × multiplier; body ≥ threshold.
Entry
On the next candle after the marker appears.
Expiration
1 candle; later test 2–3 candles based on your own stats.
Risk
Fixed trade size; no martingale during the system tuning phase.
FAQ
Decrease K and Breakout × ATR in small steps (5–10%), then — Min. body/range.
Increase Breakout × ATR and Min. body/range; check if the EMA period isn’t too small.
2–3 familiar currency pairs with stable payouts on Pocket Option; don’t spread yourself across dozens of tickers.
Summary
- We use fractal edges as levels and enter on a confirmed breakout.
- Direction is set by the EMA slope, breakout validity — by the ATR buffer.
- The “frequency vs quality” balance is tuned via K, Breakout × ATR, Min. body/range, EMA period.
- Start with cautious default settings and your own mini-stats; change parameters one at a time and assess the effect.
Trading Bot Flip Strike — a powerful signal tool for binary options
Algorithm based on the crossover of price and a UT line derived from ATR. Flexible quality filters, dynamic TTL, higher-TF trend, RSI guard, anti-chop cluster, Donchian mid, HUD card, and honest WR statistics. Presets for Pocket Option in Spectra Charts.
Trading Bot Impulse Rider — identifies impulses by MACD, RSI, and EMA
MACD impulse via histogram, RSI level filter, and EMA direction. Parameters, impact of settings, presets for OTC/real market, and a trading plan.