Trading Bot Impulse Rider — identifies impulses by MACD, RSI, and EMA

What is Impulse Rider
Impulse Rider is an entry technique at the moment of a developing impulse, when three conditions coincide at the same time: acceleration of the MACD histogram, RSI position relative to a level, and the price’s position relative to the EMA. The goal is to “catch” the move when it is already gaining strength but hasn’t yet run out of steam.
- MACD — developed by Gerald Appel; the histogram shows acceleration/deceleration of the impulse.
- RSI — proposed by J. Welles Wilder; the 50 level is often used as a simple boundary: “above — predominantly bullish tone, below — bearish.”
- EMA — exponential moving average; provides direction and a dynamic price filter.
How our bot works
- MACD histogram: the last N bars in a row are rising (for buys) or falling (for sells).
- RSI: value above the level (parameter) — for buys; below — for sells.
- EMA: price above EMA — for buys; below EMA — for sells.
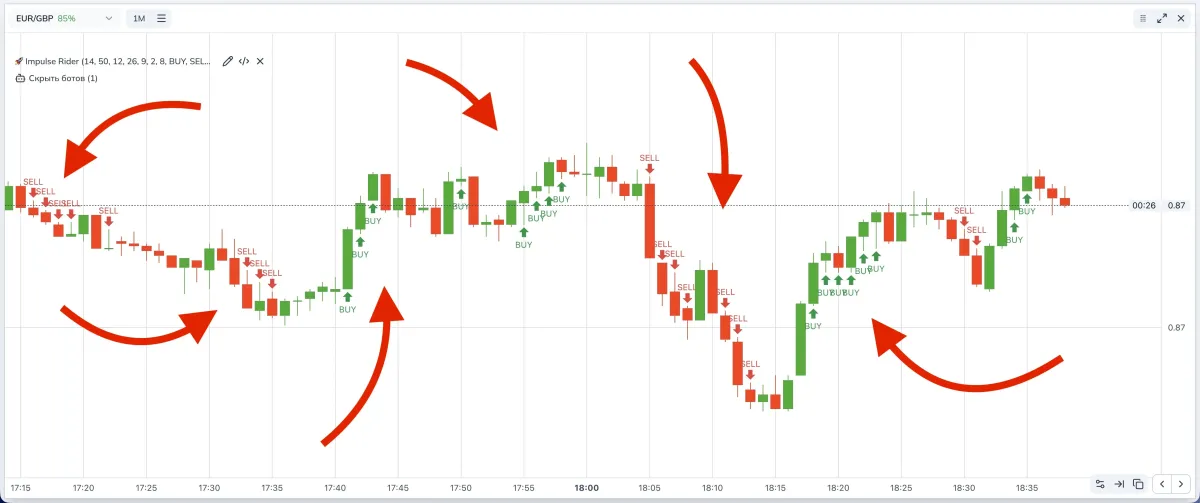
- When the conditions coincide, a BUY/SELL marker is placed on the current bar; the entry is planned on the next candle.
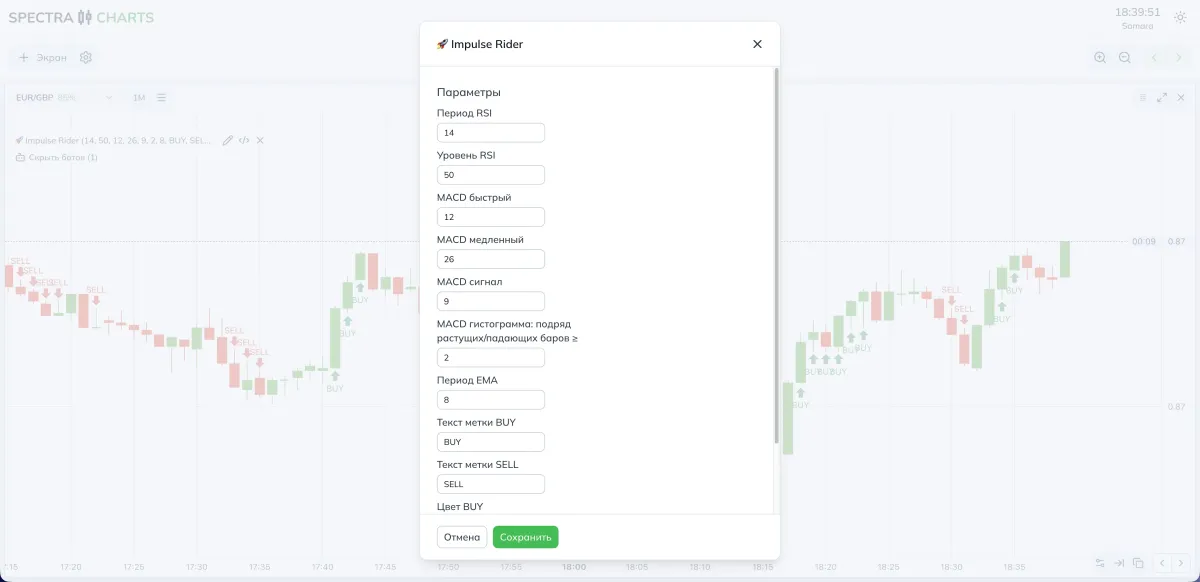
Parameters and impact
| Parameter (as in settings) | What it means | If you decrease | If you increase |
|---|---|---|---|
| RSI period | How many candles RSI considers | More sensitive, more signals, more noise | Smoother, fewer signals |
| RSI level | Impulse strength boundary (usually 50) | Easier to pass, more signals | Stricter, fewer but cleaner |
| MACD fast / slow / signal | MACD configuration | Reacts faster, more false ones | Slower, cleaner, but rarer |
| MACD histogram: consecutive bars ≥ N | Required number of consecutive rise/fall | Easier condition, more signals | Stricter, fewer but more reliable |
| EMA period | Length of the direction filter | EMA is “nervous,” more crossovers | Smoother, fewer crossovers |
| BUY/SELL label text | Arrow captions | — | — |
| BUY/SELL color | Marker color | — | — |
- More signals: lower the RSI level, reduce N consecutive histogram bars, shorten the RSI and EMA periods.
- Fewer but more accurate: raise the RSI level, increase N, lengthen RSI/EMA, keep MACD settings moderate.
Modes and presets
- RSI period: 14
- RSI level: 50
- MACD: 12 / 26 / 9
- MACD histogram (N consecutive bars): 2
- EMA: 8
- If there are few signals: lower the RSI level by 5–10 points or reduce N to 2.
- RSI level: 52–55
- MACD histogram (N consecutive bars): 3
- EMA: 8–13
- Explanation: stricter filters cut off weak spikes around news.
Filter combinations
- Market tone via RSI: raise the RSI level in prolonged trends, lower it in ranges.
- MACD impulse: increase N where “half-bars” without continuation occur frequently.
- EMA as a rail: a short EMA = more touches and entries; a longer EMA = fewer “leaps” across the average.
Where to view signals in Spectra Charts
Open the asset on Pocket Option in Spectra Charts.
Connect the Impulse Rider bot.
Check the timeframe (1 minute is convenient to start).
Watch the BUY/SELL markers and the parameters panel.
Trading plan
BUY conditions
MACD histogram rises for N bars in a row, RSI > level, price above EMA.
SELL conditions
Histogram falls for N bars, RSI < level, price below EMA.
Entry
On the next candle after the marker appears.
Expiration
1 candle; later test 2–3 candles.
Risk
Fixed trade size; no martingale during the tuning phase.
FAQ
Lower the RSI level and/or N (consecutive histogram bars). If needed, shorten the EMA period.
Raise the RSI level, increase N, lengthen the RSI and EMA periods. Check that the MACD parameters aren’t too “fast.”
2–3 currency pairs with stable payouts on Pocket Option; don’t spread yourself across a large list.
Summary
Impulse Rider combines the MACD impulse, the strength threshold via RSI, and the EMA direction. Control entry frequency via the RSI level, N histogram bars, and the EMA/RSI lengths; change one parameter at a time and record the result.
Trading Bot Fractal Edge Breakout — breakout of fractal edges
Bill Williams’ fractal levels, the Fractal Edge Breakout strategy idea and its implementation in the bot: signal logic, parameters, settings for OTC/real market, examples, and a trading plan.
Signal Bot MACD Cross — fast detection of MACD crossovers with the signal line
Classic entry based on the crossover of MACD and the signal line. A breakdown of the idea, the indicator’s origin, the bot’s logic, parameter impact, presets for OTC/real market, and a trading plan.