Signal Bot MACD Cross — fast detection of MACD crossovers with the signal line
What is MACD Cross
MACD Cross is an entry approach based on the crossover of the MACD line and the signal line.
MACD (Moving Average Convergence/Divergence) was developed by Gerald Appel. The MACD line is the difference between EMA (fast) and EMA (slow); the signal line is a smoothed EMA of the MACD itself.
The idea: when MACD crosses the signal line from below upward, the impulse accelerates bullishly; when it crosses from above downward — bearishly.
- MACD line = EMA(fast) − EMA(slow)
- Signal line = EMA of MACD
- Histogram = MACD − signal (not used directly in this bot)
How our bot works
- Calculates MACD by the fast/slow/signal parameters.
- Tracks the fact of crossover:
- BUY — MACD is above the signal line after having been below it on the previous bar.
- SELL — MACD is below the signal line after having been above it on the previous bar.
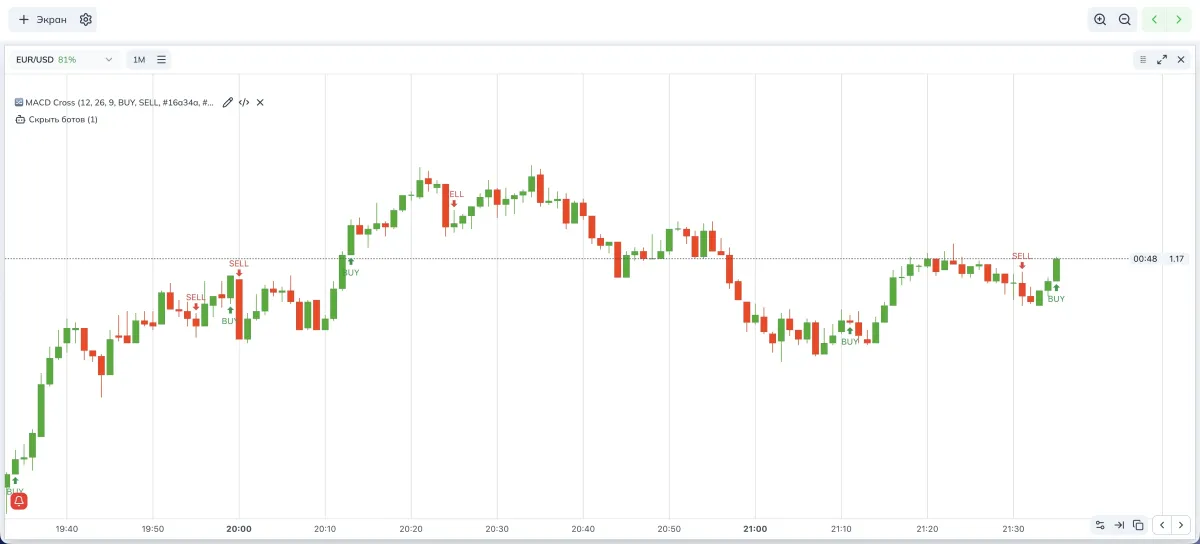
- Places a BUY/SELL marker on the crossover bar (an arrow and text are shown on the chart).
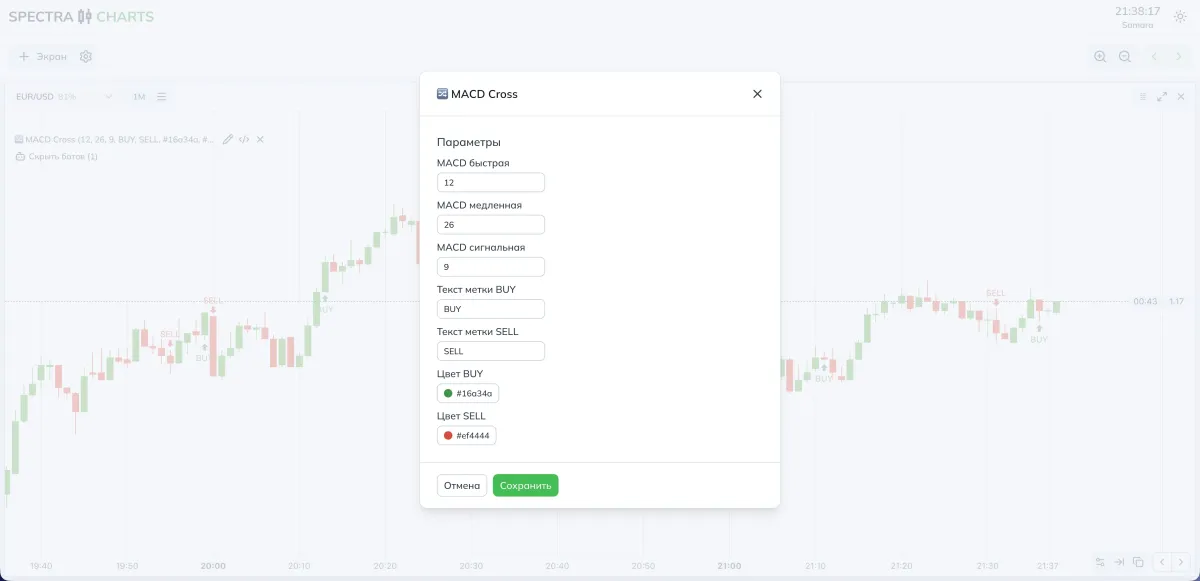
Parameters and impact
| Parameter (as in settings) | What it means | If you decrease | If you increase |
|---|---|---|---|
| MACD fast | Period of the fast EMA | More sensitive, more crossovers | Smoother, fewer crossovers |
| MACD slow | Period of the slow EMA | More sensitive, more noisy crossovers | Smoother, less noise |
| MACD signal | EMA smoothing of the MACD line | Signal comes faster, earlier, but noisier | Signal comes later, cleaner, but later |
| BUY/SELL label text | Captions for arrows | — | — |
| BUY/SELL color | Color of arrows and text | — | — |
- More signals: reduce the fast and signal; if needed, slightly lower the slow.
- Fewer but clearer: increase the slow and/or signal; keep the fast moderate.
Modes and presets
- MACD: 12 / 26 / 9
- Character: more reactive, more crossovers
- If there are too many crossovers: raise the signal (e.g., to 11–12) or increase the slow to 28–30
- MACD: 12 / 26 / 9 (base)
- To filter noise: increase the signal to 10–12 or the slow to 28–30
- In a sustained trend: you can keep the base and control frequency via the timeframe
Combinations and practical notes
- Timeframe controls pace: lower TF — more crossovers, more noise; higher TF — fewer, more stable.
- Trend backdrop: if you want to trade only with the trend, you may externally restrict trades (e.g., take BUYs when price is above a chosen EMA).
- News window: during volatility spikes, it’s better to switch to a stricter signal.
Where to view signals in Spectra Charts
Open the asset on Pocket Option in Spectra Charts.
Connect the MACD Cross bot.
Check the timeframe; start with 1 minute.
Watch the BUY/SELL arrows at crossover points.
Trading plan
BUY
On the bar where MACD crossed the signal from below upward; plan the entry on the next candle.
SELL
On the bar where MACD crossed the signal from above downward; entry — on the next candle.
Expiration
1 candle; later test 2–3 candles based on your own stats.
Risk
Fixed trade size; no martingale during the tuning phase.
FAQ
Increase the signal and/or slow; if necessary, raise the timeframe.
Lower the signal; carefully reduce the slow to speed up the reaction.
2–3 currency pairs with stable payouts; don’t spread yourself across a large list.
Summary
MACD Cross relies on a straightforward trigger — the crossover of MACD and the signal line. Frequency and quality are adjusted by three periods: fast, slow, signal. Tune them to your needs, changing one parameter at a time and recording the result.
Trading Bot Impulse Rider — identifies impulses by MACD, RSI, and EMA
MACD impulse via histogram, RSI level filter, and EMA direction. Parameters, impact of settings, presets for OTC/real market, and a trading plan.
Trading Bot RSI Classic — entry signals based on oversold and overbought levels
J. Welles Wilder’s RSI, the 70/30 threshold idea, and implementation in the bot: signal logic, parameter impact, recommendations for OTC and the real market, and a trading plan.