Trading Bot RSI Classic — entry signals based on oversold and overbought levels
What is RSI Classic
RSI Classic is an entry approach based on the Relative Strength Index (RSI). The index measures the share of rising and falling moves over a chosen period and shows where the market is overbought or oversold. In the classic approach, the 70 and 30 levels are used as landmarks for reversals and mean reversion.
- Origin: RSI was proposed by J. Welles Wilder.
- Values range from 0 to 100. The area above 70 is considered overbought, below 30 — oversold.
- The levels can be adjusted to the dynamics of a specific asset.
How our bot works
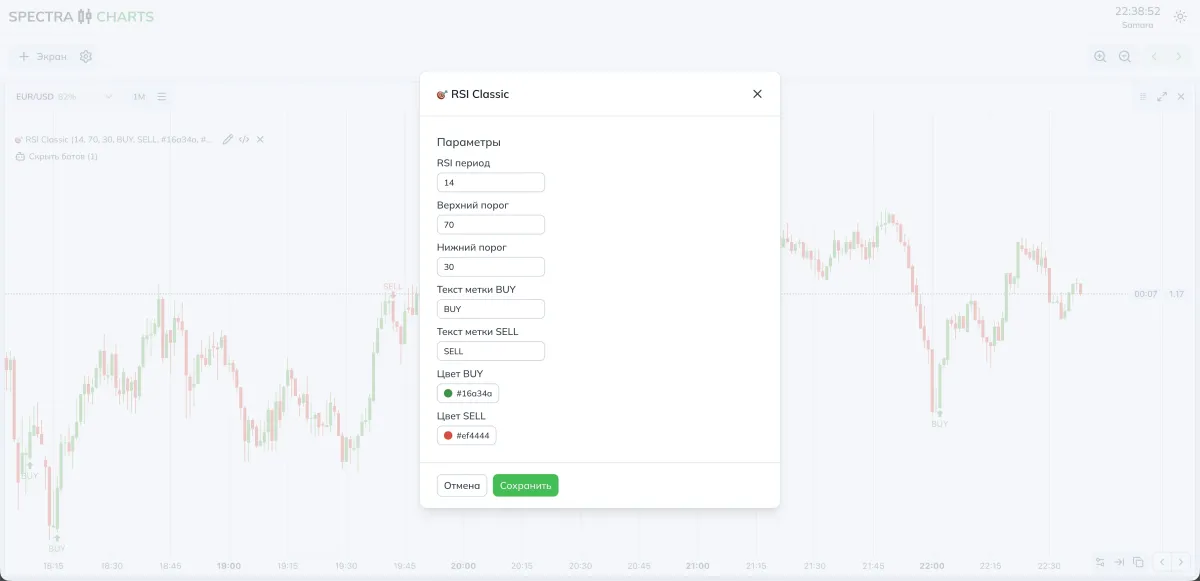
- Calculates RSI with the window length from the RSI period parameter
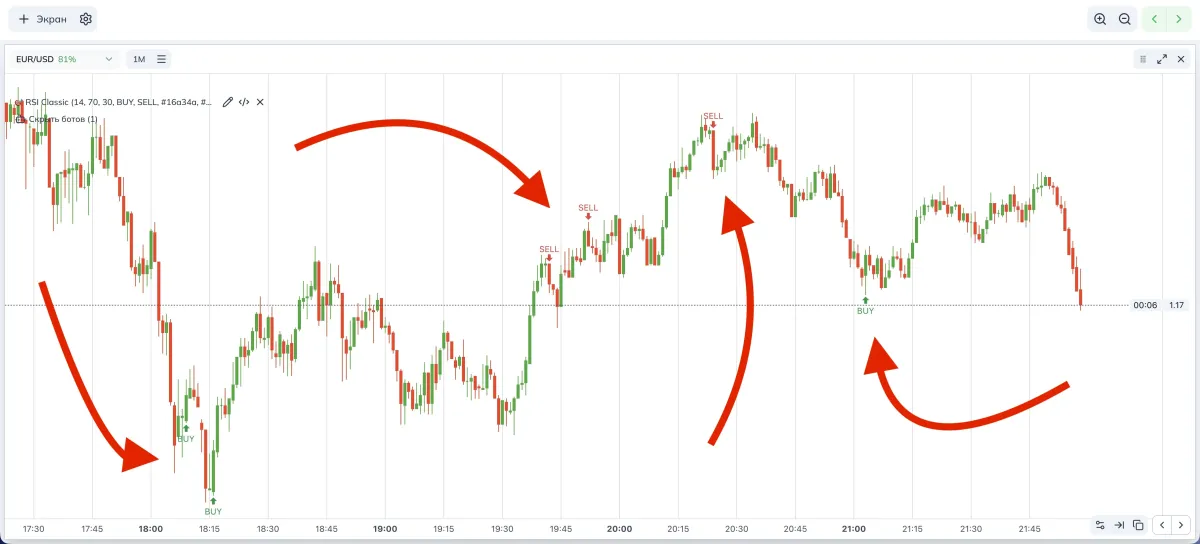
- Tracks level crossings
- BUY — when RSI rises above the Lower threshold
- SELL — when RSI drops below the Upper threshold
- Places BUY and SELL markers on the crossing bar, and the entry is planned on the next candle
Parameters and impact
| Parameter (as in settings) | What it means | If you decrease | If you increase |
|---|---|---|---|
| RSI period | How many candles RSI considers | The indicator becomes more sensitive, more signals, but noisier | The indicator smooths out, fewer signals, but cleaner |
| Upper threshold | Overbought boundary for SELL | Easier to cross, more signals | Harder to cross, fewer signals, higher quality |
| Lower threshold | Oversold boundary for BUY | Easier to cross, more signals | Harder to cross, fewer signals, higher quality |
| BUY/SELL label text | Captions for arrows on the chart | — | — |
| BUY/SELL color | Color of arrows and label text | — | — |
- More signals — reduce the RSI period, lower the Upper threshold, raise the Lower threshold
- Fewer but clearer — increase the RSI period, raise the Upper threshold, lower the Lower threshold
Parameter recommendations
- RSI period: 14
- Upper threshold: 70
- Lower threshold: 30
- If there are few signals: lower the Upper threshold to 65 and raise the Lower threshold to 35; if necessary, reduce the RSI period to 12
- RSI period: 14–21
- Upper threshold: 72–75
- Lower threshold: 25–28
- Why: stricter levels reduce the number of false crossings during news periods and extended volatility
Combinations and tips
- Range-bound market
Raise the Lower threshold and lower the Upper threshold; entries will be more frequent, but keep an eye on quality - Trending market
Keep the levels stricter and the RSI period higher to filter traps against the trend - Sync with timeframe
On lower timeframes there are more crossings and more noise; on higher ones they are rarer and more stable
Where to view signals in Spectra Charts
Open an asset on Pocket Option in Spectra Charts
Connect the RSI Classic bot
Choose a timeframe; it’s convenient to start with 1 minute
Watch for BUY and SELL arrows at the threshold crossings
Trading plan
BUY
RSI crossed the Lower threshold from below upward, the marker appeared on the current bar
The entry is planned on the next candle
SELL
RSI crossed the Upper threshold from above downward, the marker appeared on the current bar
The entry is planned on the next candle
Expiration
One candle; later test two and three candles based on your stats
Risk
Fixed trade size; no martingale during the tuning phase
FAQ
Lower the Upper threshold, raise the Lower threshold; if necessary, reduce the RSI period
Raise the Upper threshold and lower the Lower threshold, increase the RSI period, check the timeframe
Two or three currency pairs with stable payouts; don’t spread yourself across a large list
Summary
RSI Classic relies on the clear overbought and oversold levels. The frequency and quality of signals are controlled by the RSI period, Upper threshold, and Lower threshold. Change parameters one at a time and record the result to find your balance between the number and accuracy of entries faster
Signal Bot MACD Cross — fast detection of MACD crossovers with the signal line
Classic entry based on the crossover of MACD and the signal line. A breakdown of the idea, the indicator’s origin, the bot’s logic, parameter impact, presets for OTC/real market, and a trading plan.
Indicator Trend Signals — moving average crossovers for a quick view of the current trend
Two EMAs combine into a trend indicator with intuitive line recoloring only when crossed by price, and also place handy visual BUY/SELL signals via the indicator’s built-in algorithms.