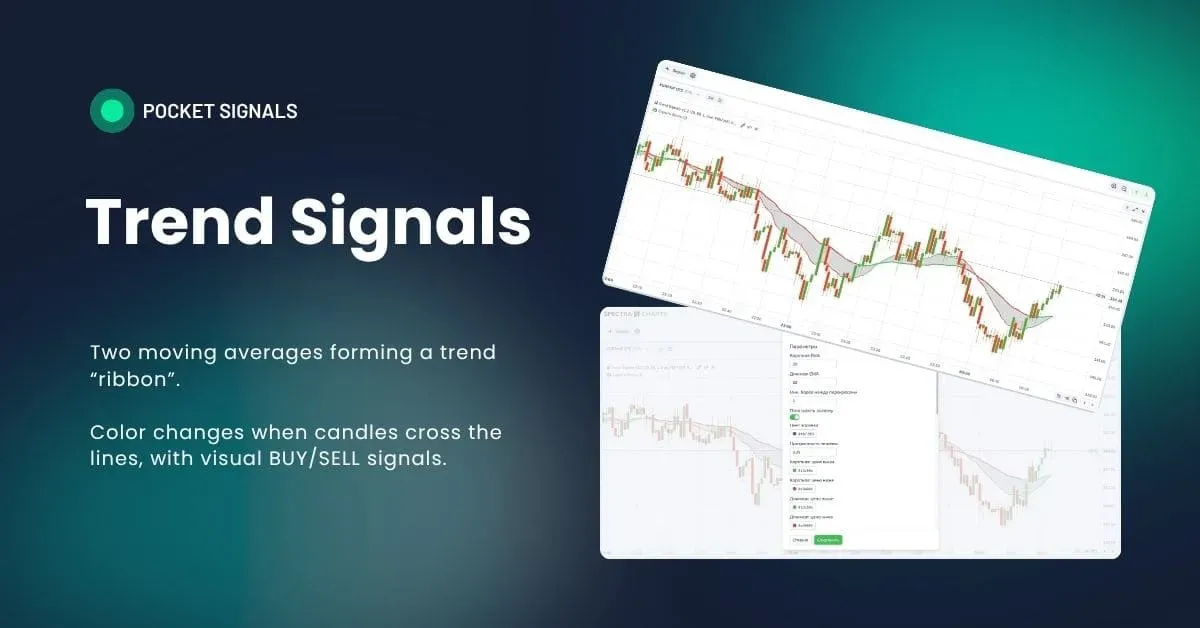
Indicator Trend Signals — moving average crossovers for a quick view of the current trend
Why you need it
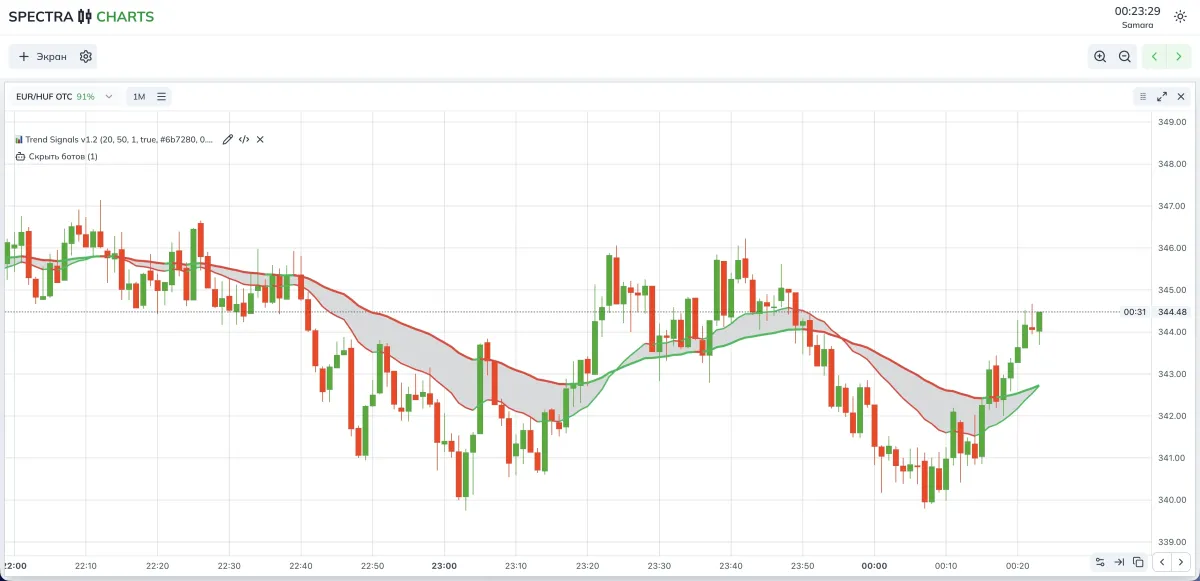
Trend Signals makes the trend on the chart intuitive and readable. Two EMAs form a ribbon; line colors change only on a real candle crossover, without jitter. Between the lines is a neat fill; on impulses BUY/SELL arrows from MACD turn on; weak moments are filtered using ADX.
In binary options this is a quick way to see direction and the best entry points.
How it works
- EMA ribbon (Trend Signals). A short and a long EMA form a corridor. The color of each line is tied to the fact of where price is — above or below.
- Anti-chatter. The “Min. bars between recolors” parameter holds the color until the next meaningful cross.
- Fill between EMAs. Clearly shows trend expansion and contraction without overloading the background.
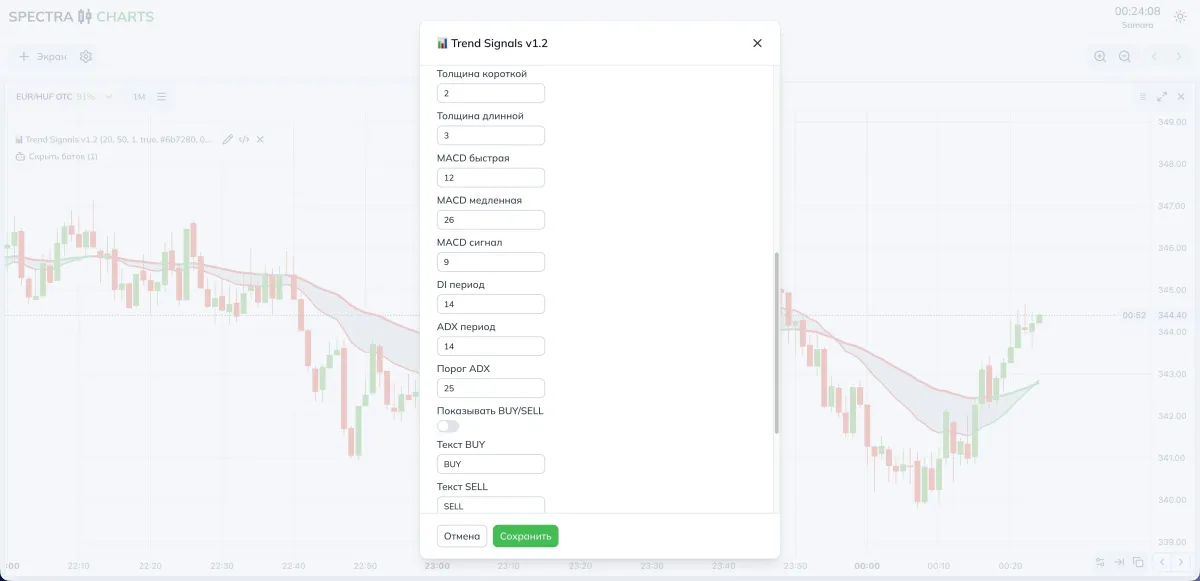
- MACD → arrows. MACD/signal crosses produce BUY/SELL markers.
- ADX/DI → strength. If trend strength is below the ADX threshold, arrows aren’t drawn — Trend Signals remains your orientation.
Indicator parameters (visual)
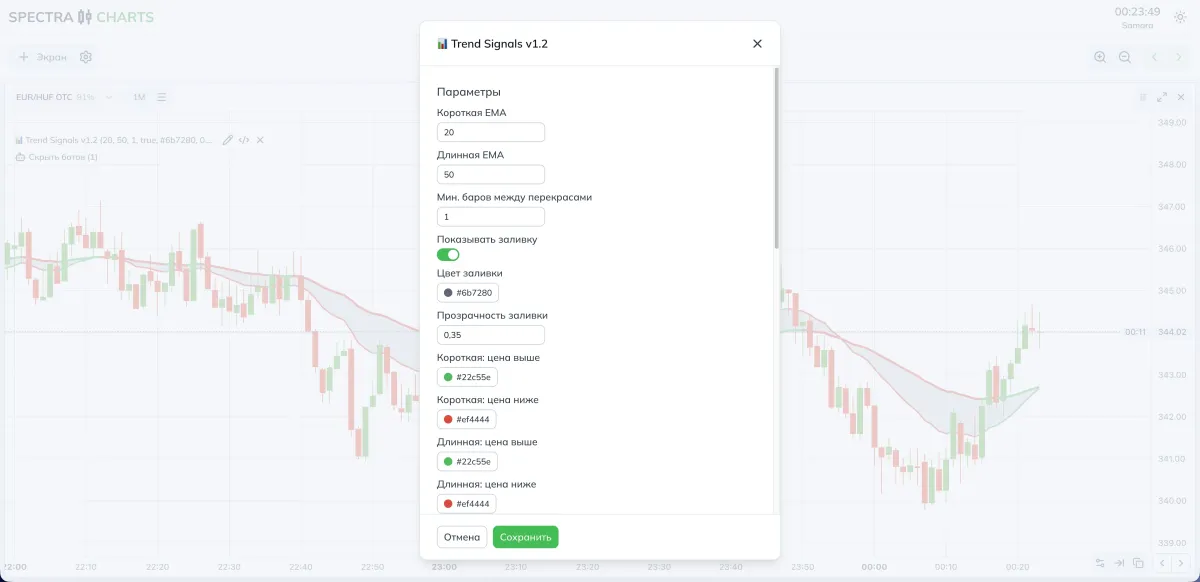
Parameters
EMA and stability
| Parameter | What it does | If you decrease | If you increase |
|---|---|---|---|
| Short EMA | Fast line reaction | More sensitivity | Smoother, later |
| Long EMA | Slow trend base | More frequent shifts | More stable backdrop |
| Min. bars between recolors | Anti-chop protection | More reactions | Fewer reactions, cleaner |
Fill
| Parameter | What it does | If you decrease | If you increase |
|---|---|---|---|
| Show fill | Turns on the ribbon background | Minimalism | More clarity |
| Fill color | Corridor palette | Lighter | Darker, more accent |
| Fill opacity | Saturation | Softer | Brighter |
Colors and thickness
| Parameter | What it does |
|---|---|
| Short: price above/below | Color of the fast EMA above and below price |
| Long: price above/below | Color of the slow EMA above and below price |
| Thickness short/long | Visual weight of the lines |
MACD arrows and ADX filter
| Parameter | What it does | If you decrease | If you increase |
|---|---|---|---|
| MACD fast | MACD reaction speed | More sensitive | Smoother |
| MACD slow | Base for comparison | More crosses | Rarer, more confident |
| MACD signal | Trigger smoothing | Earlier trigger | Later, but steadier |
| DI period | DI window | Livelier | More stable |
| ADX period | ADX window | Livelier | Smoother |
| ADX threshold | Minimum strength | More arrows | Fewer, but cleaner |
Markers
| Parameter | What it does |
|---|---|
| Show BUY/SELL | Enables MACD-based arrows with ADX filter |
| Text and colors | Arrow labels and palette |
Presets
- Short EMA 12–20
- Long EMA 40–55
- Min. bars between recolors 1–2
- Fill on, opacity 0.30–0.40
- MACD 12-26-9
- ADX threshold 20–25
- BUY/SELL enable
- Short EMA 20–30
- Long EMA 50–80
- Min. bars between recolors 2–3
- Fill on, opacity 0.30
- MACD 12-26-9 or 24-52-9 for smoothness
- ADX threshold 25–30
- BUY/SELL optional
How to adjust the number of signals
- Need more — shorter EMAs, lower ADX threshold, smaller Min. bars between recolors, shorter MACD signal.
- Need cleaner — longer EMAs, higher ADX threshold, larger Min. bars between recolors, longer MACD signal.
Combination ideas
- Trend Signals plus levels — a level break with recoloring gives a good impulse.
- Trend Signals plus Range Detector — a range breakout and a stable ribbon color confirm the move.
- Trend Signals as a direction filter for your bots from PoSignals.
Step-by-step strategy
Context
Watch the ribbon in Spectra Charts. Ideally — a fresh recolor and normal volatility.
Trigger
Recolor in the entry direction; with arrows enabled — MACD cross and ADX above the threshold.
Entry
For a careful start — on the next candle after confirmation.
Expiration
OTC — one candle; in a calm trend test two.
Real market — usually two candles.
Risk
Fix your stake size. If Trend Signals quickly flipped or keeps changing color, skip and wait for a new signal.
FAQ
Increase Min. bars between recolors and the lengths of Short EMA and Long EMA — the noise disappears and the trend becomes smoother.
Raise the ADX threshold and lengthen the MACD signal; if needed, temporarily turn Show BUY/SELL off.
Lower Fill opacity or disable Show fill — the EMA lines will still guide you.
Shorten EMA lengths, lower the ADX threshold, shorten the MACD signal, and reduce Min. bars between recolors.
Trading Bot RSI Classic — entry signals based on oversold and overbought levels
J. Welles Wilder’s RSI, the 70/30 threshold idea, and implementation in the bot: signal logic, parameter impact, recommendations for OTC and the real market, and a trading plan.
Sloped Levels Indicator — automatic construction
Draws sloped support and resistance from fresh pivots, supports simple and “strong” lines, extends them to the current price, and marks breakouts with a dashed style