Sloped Levels Indicator — automatic construction
What this indicator is
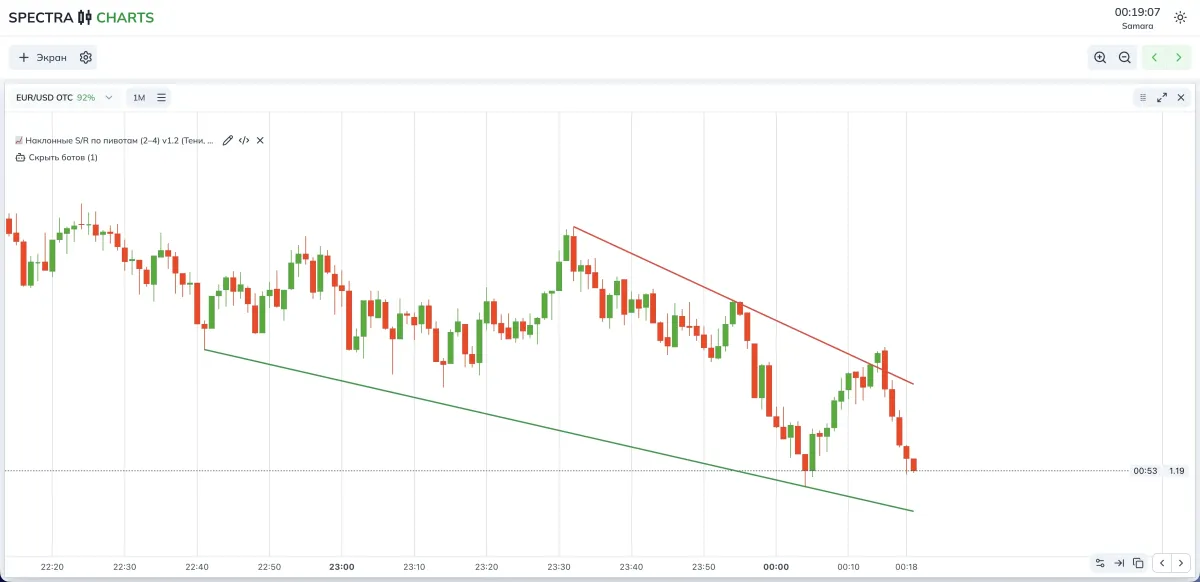
Sloped levels are lines that connect significant local highs and lows, also called pivots. Highs give you a sloped resistance, lows a sloped support. This frame helps you read trends and channels, understand where to expect a bounce, and where a breakout with continuation is likely.
The indicator builds two kinds of lines at once — simple (from the last 2–4 pivots) and strong, where selection is stricter and distance/slope are controlled automatically. Lines can be extended to the current candle, and when a breakout occurs they turn dashed. It’s a fast guide for “bounce off level,” “breakout,” and “retest” tactics.
- Note: a pivot is a local high or low.
- Connect pivots to get a sloped level.
- Price touches the level — a bounce is possible; a confident pass through it — a breakout.
Construction modes
- Simple — quickly connects 2–4 fresh pivots with one line, tolerates small touch errors. Handy when you need a stream of workable levels.
- Strong levels — selects a dominant pair with good distance and slope, ignores small noise. These are “reference” lines for a longer-term plan.
- Both — draws simple and strong at the same time; simple lines are slightly thinner to avoid confusion.
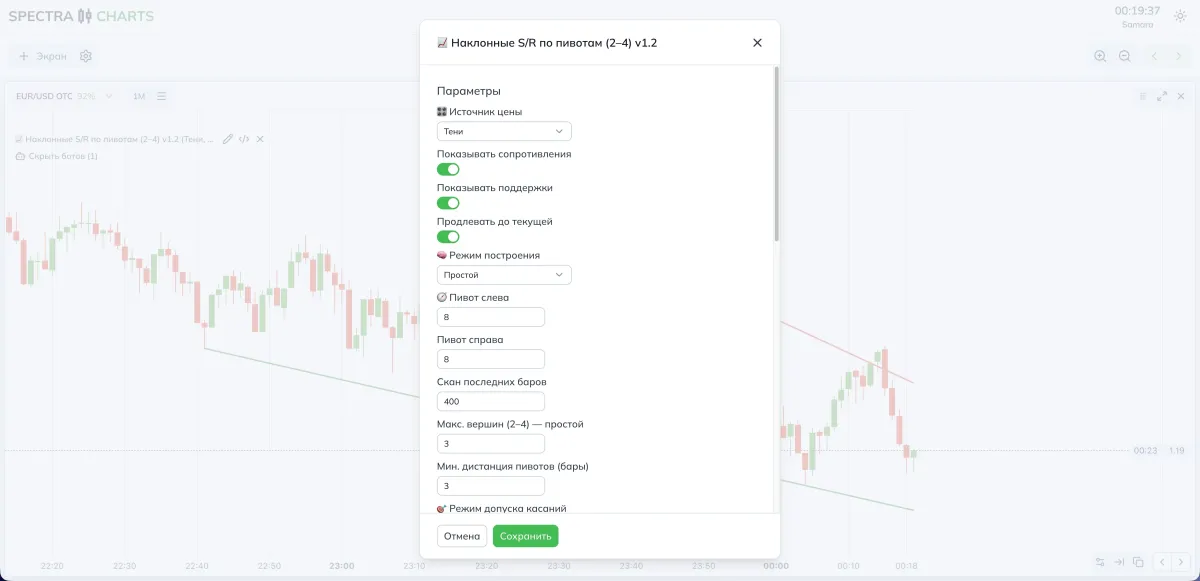
Indicator parameters (visual)
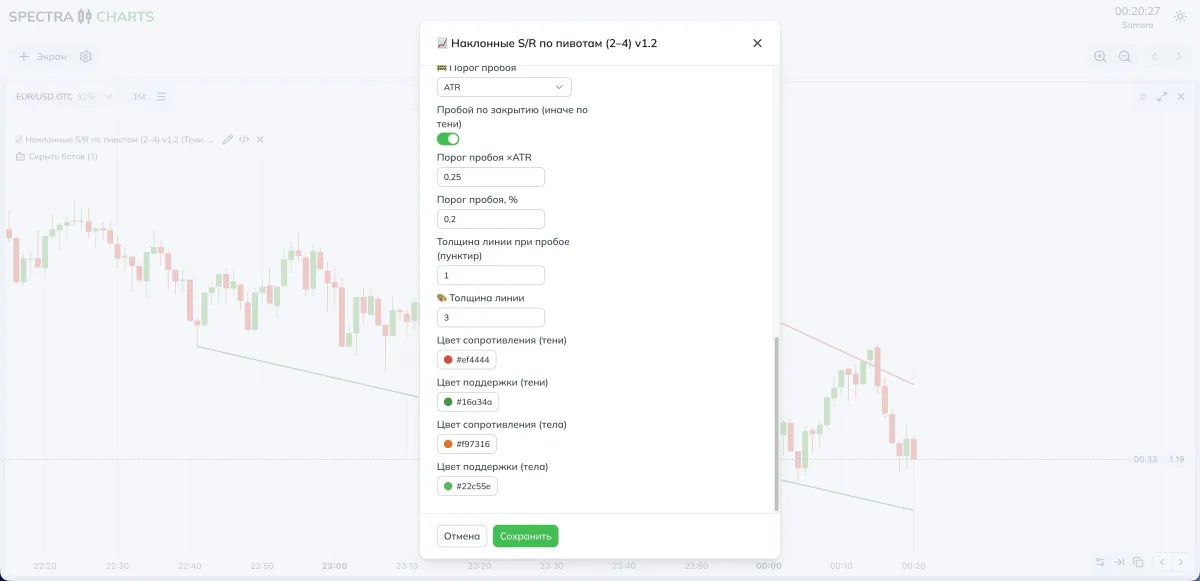
Parameters and impact
What to draw
| Parameter | What it does | If you decrease/disable | If you increase/enable |
|---|---|---|---|
| Price source | Wicks, bodies, or both | Only one touch type | More confirmations across prices |
| Show resistances | Upper lines | Less clutter | Full picture |
| Show supports | Lower lines | Less clutter | Full picture |
| Extend to current | Extends the level to the latest candle | Shorter line | See the current contact point |
Construction mode
| Parameter | What it does | If you choose |
|---|---|---|
| Simple | Fast levels from 2–4 pivots | More signals |
| Strong levels | Dominant-line selection | Rarer but weightier |
| Both | Combo of both approaches | Background and key rails visible |
Pivot search
| Parameter | What it does | Lower | Higher |
|---|---|---|---|
| Pivot left and right | Pivot sensitivity | More pivots | Fewer pivots, but cleaner |
| Scan last bars | History depth | Faster, more local | Broader picture |
| Max points (2–4) | How many points used in simple mode | Minimalism | Line more robust |
| Min pivot distance | Protection from nearby duplicates | More marks | Rarer, cleaner crests |
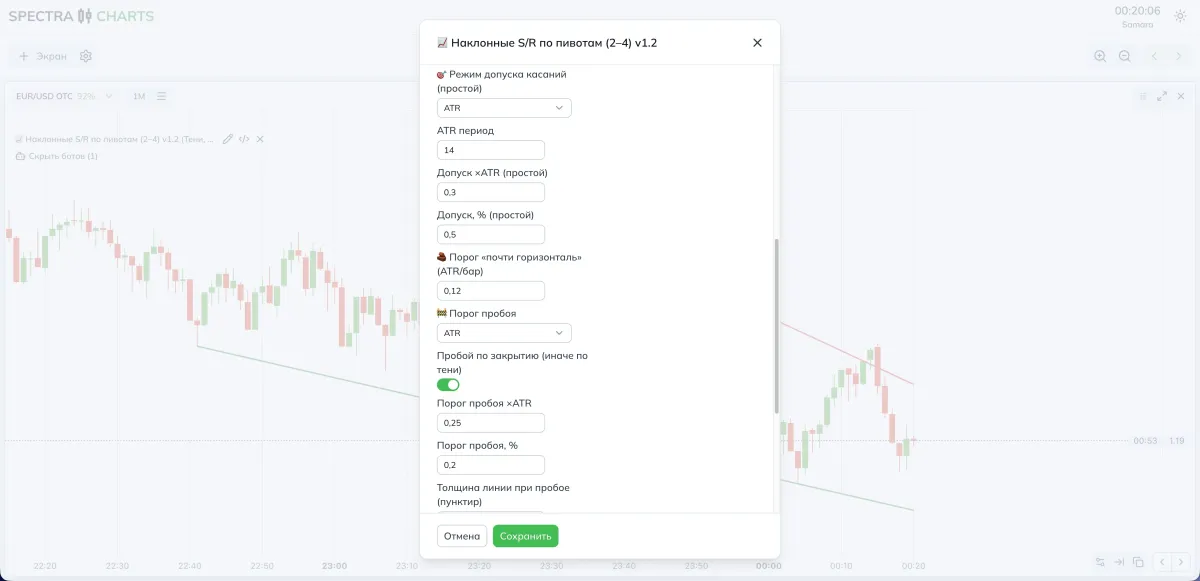
Touch tolerance — for simple mode
| Parameter | What it does | Lower | Higher |
|---|---|---|---|
| Tolerance mode | Off, ATR, percent | Strict accuracy | More forgiving to noise |
| ATR period | Basis for tolerance | More reactive | Smoother |
| Tolerance ×ATR / Tolerance, % | Allowed deviation | Fewer false touches | Lines persist longer |
“Almost horizontal” and breakout
| Parameter | What it does | Lower | Higher |
|---|---|---|---|
| “Almost horizontal” threshold | Cuts overly flat lines | More sloped ones | More flat channels |
| Breakout threshold (ATR or %) | How far price must travel beyond the line | Breakouts more often | Rarer but more confident |
| Breakout by close | Measure by close instead of wick | Fewer false signals | Earlier signal |
| Line thickness on breakout | Dashed after breakout | Barely noticeable | Emphasis on the event |
Visual
| Parameter | What it does |
|---|---|
| Line thickness | Overall level readability |
| Resistance/Support colors for wicks and bodies | Palette for your theme |
How to tune to your style
- More signals — Simple mode, small tolerance ×ATR, pivots 2–2, smaller min pivot distance, extension on.
- Fewer but cleaner — Strong levels mode, higher pivot strictness, higher breakout threshold, breakout by close.
Practical presets
- Source — Both
- Mode — Simple
- Pivots — 2–2
- Scan — 200–400 bars
- Tolerance — ATR, 0.25–0.35, ATR period 14
- Breakout — ATR, 0.20–0.25, by close
- Extend — on
- Source — Bodies
- Mode — Strong levels
- Pivots — 3–3 or 4–4
- Scan — 600–1200 bars
- “Almost horizontal” threshold — 0.10–0.14 ATR/bar
- Breakout — %, 0.20–0.40, by close
- Extend — on
Combination ideas with other tools
- Trend Signals — take trades only in the EMA ribbon’s direction; sloped levels become your entry point.
- Range Detector — mark the range first, then switch to sloped lines when an exit begins.
- Order Blocks — a level is stronger if a fresh OB nearby points the same way.
Trading scheme for binary options
Context
Pick an asset in Spectra Charts, turn on sloped S/R, and make sure there’s a clear support or resistance line near price.
Bounce
Wait for a touch of the level; a candle reacts off it; take the next candle in the direction of the bounce.
Tip: body-based levels are tidier; wick-based react earlier.
Breakout–retest
Price crosses the level beyond the threshold, the line turns dashed; wait for a quick retest from the backside and take continuation.
Expiration
On OTC start with one candle; in calm movement test two.
On the real market two candles work more often if the impulse isn’t jagged.
Risk
Fix your position size; don’t average against the level; skip trades if several intersecting lines are clustered nearby.
FAQ
That’s normal for fresh pivots. Increase Pivot left/right and Min pivot distance, or switch to Strong levels mode.
Leave only the needed sides, reduce Scan last bars, raise breakout thresholds, and use Strong levels mode.
Count Breakout by close and increase the breakout threshold in ATR or percent.
Raise the “Almost horizontal” threshold and switch the source to Bodies to cut wick noise.
Indicator Trend Signals — moving average crossovers for a quick view of the current trend
Two EMAs combine into a trend indicator with intuitive line recoloring only when crossed by price, and also place handy visual BUY/SELL signals via the indicator’s built-in algorithms.
Stoch Levels Overlay — classic stochastic oscillator over the chart
Overlays stochastic 0/20/80/100 levels directly on candles: soft overbought/oversold zones, guide lines, and an optional %K/%D projection. Convenient for catching reversals at channel edges and disciplining entries with Spectra Charts.