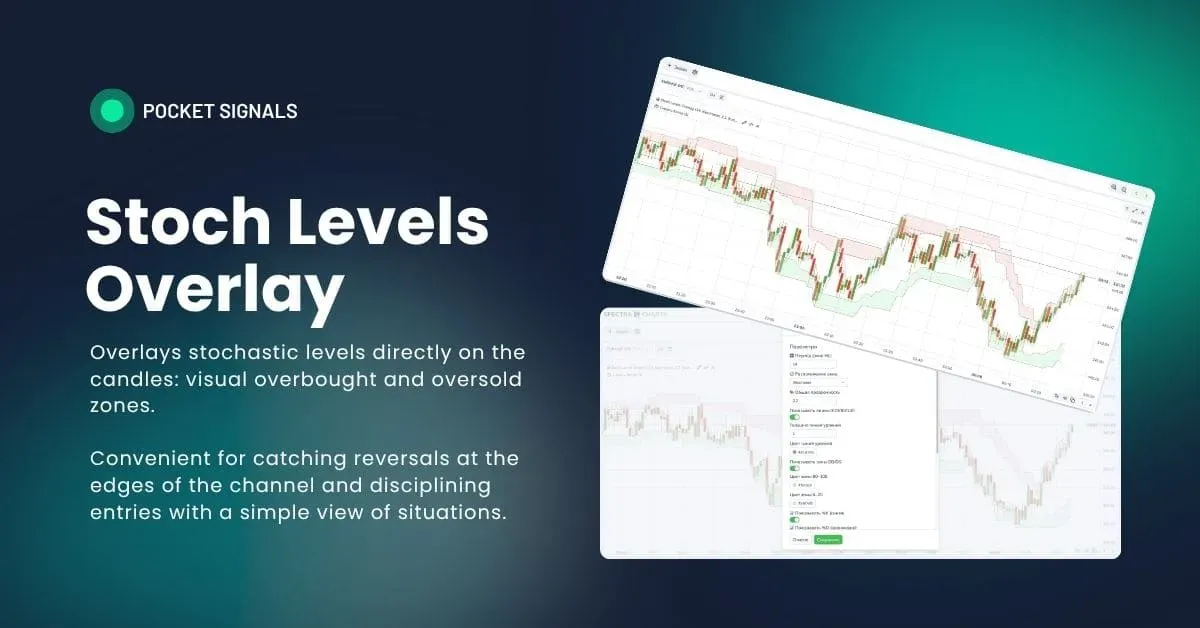
Stoch Levels Overlay — classic stochastic oscillator over the chart
Why this is needed
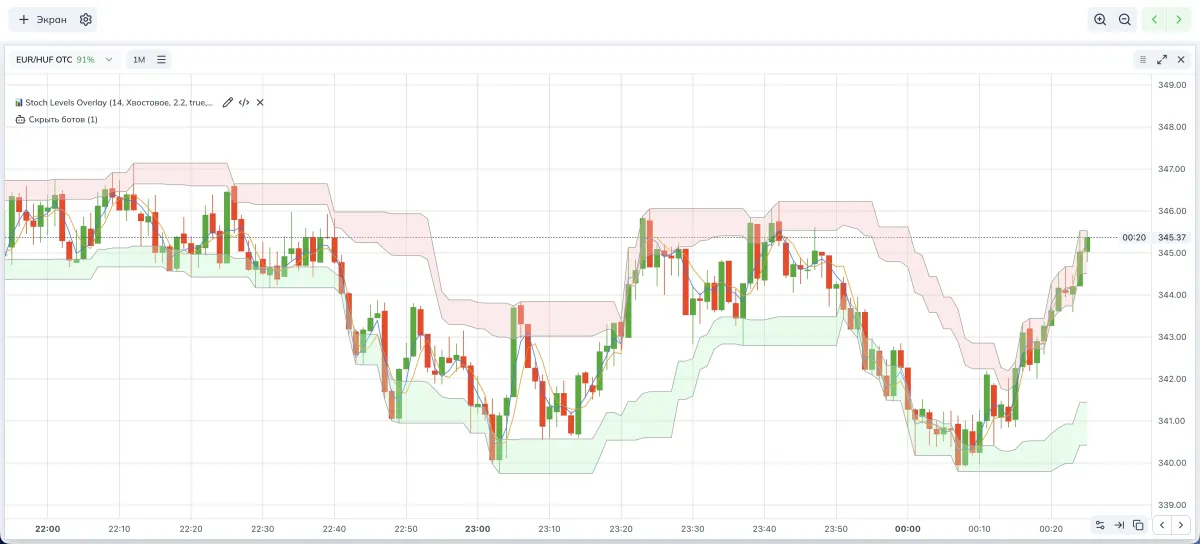
Stoch Levels Overlay brings the stochastic logic out of a separate pane right into the price space. On the chart you see two soft areas — overbought (80–100) and oversold (0–20) — plus thin guide lines 0/20/80/100. You can also draw %K and %D lines if you like, but not in percentages — in prices of the current channel — so the entry moment is readable without glancing down.
As a result, you get visible “corridor edges” where it’s convenient to look for a bounce or breakout with continuation — especially on short timeframes on Pocket Option.
- OB/OS — overbought/oversold.
- %K/%D — stochastic lines; %D is a smoothed version of %K.
How it works
- Take a rolling High/Low window of length Period (HL window) and compute its range.
- Draw 0/20/80/100% lines of this range and fill the 0–20 and 80–100 zones.
- Optionally project %K/%D into prices: %K and %D become thin guides through the middle of the channel — this helps you see the exact price where the signal turned.
Indicator parameters (visual)
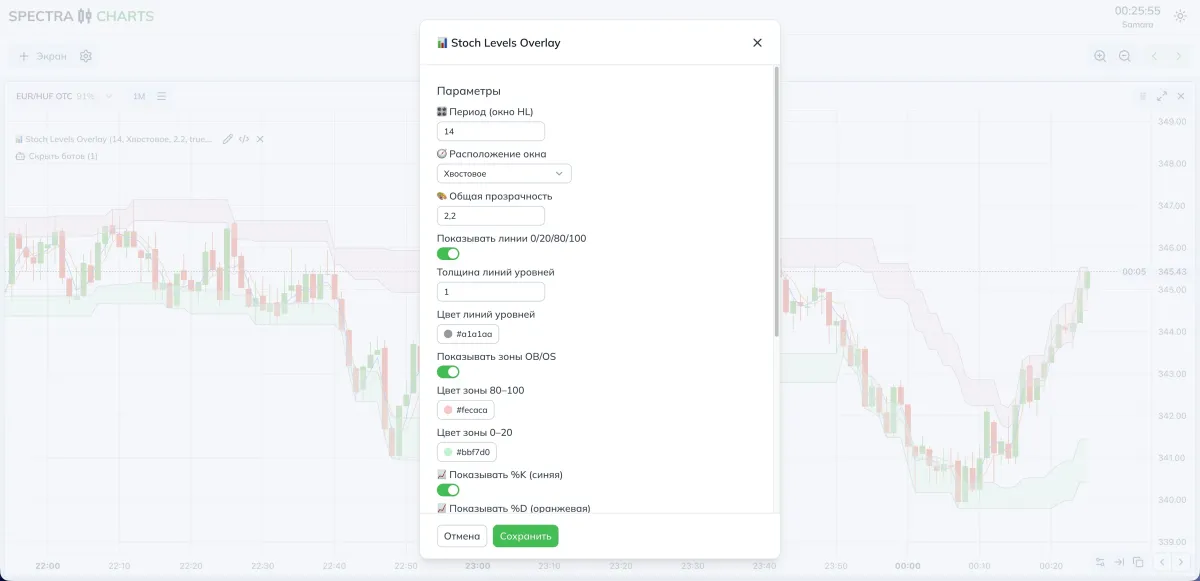
Parameters and impact
Window
| Parameter | What it does | Lower | Higher |
|---|---|---|---|
| Period (HL window) | Length of the range within which we measure price position | Reacts faster, more noise | Smoother, anchors are steadier |
| Window placement | Trailing or centered | Classic look | Straighter lines in trend |
Levels and zones visuals
| Parameter | What it does | Lower | Higher |
|---|---|---|---|
| Overall opacity | Saturation of all layers | Subtle | Emphasis on zones |
| Show 0/20/80/100 lines | Thin guides | Cleaner background | More precise edge entries |
| Line thickness/color | Guide line style | Minimalism | Emphasize levels more |
| Show OB/OS zones | Fill for 80–100 and 0–20 | More focus on candles | Easier to see touches |
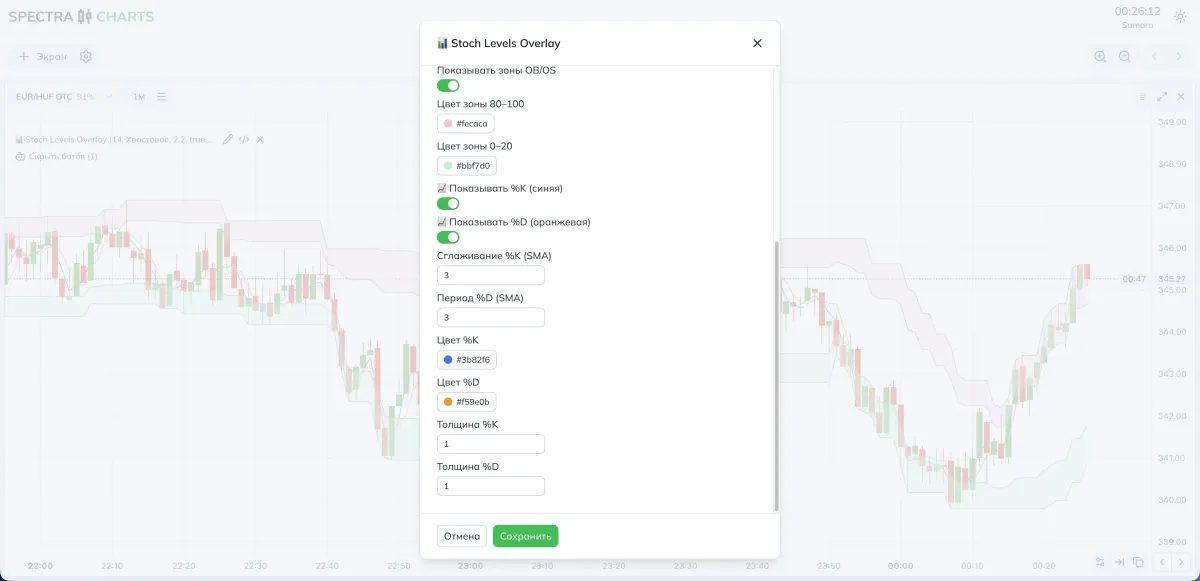
%K / %D lines on price
| Parameter | What it does | Lower | Higher |
|---|---|---|---|
| Show %K / %D | Turn the lines on | Cleaner background | More timing cues |
| %K smoothing | SMA for the “fast” line | Earlier signal | Less chop |
| %D period | SMA of %K | More sensitive | Calmer |
| %K/%D color/thickness | Line visibility | More neutral | More expressive |
Tune it to your style
- More triggers — smaller HL Period (9–12), turn %K on, smoothing 2–3, zones enabled.
- Fewer but cleaner — period 14–21, work from 20/80 lines by close, unhurried %D (3–5), zones semi-transparent.
Practical presets
- HL Period: 12–14
- Placement: Trailing
- 0/20/80/100 lines: on, thickness 1–2
- Zones: on, opacity 0.25–0.35
- %K: on, smoothing 2–3
- %D: off, or 2 if you want a confirming cross
- HL Period: 18–21
- Placement: Centered
- 0/20/80/100 lines: on, thin
- Zones: moderate so as not to cover candles
- %K/%D: both on, 3/3 or 3/5 to filter noise
How to combine
- Trend Signals (EMA ribbon): trade from 20/80 zones only in the ribbon’s trend direction. Skip opposite touches.
- Flip Strike: use the overlay as a “timing trigger” after an arrow appears. Touch at 80 → SELL, at 20 → BUY, if it aligns with the signal.
- Range Detector: inside a range, 20/80 touches work more often; at channel edges — prioritize bounces.
Trading scheme (binary options)
Context
Determine trend on your TF (using Trend Signals or another trend filter). On the chart, enable 0–20/80–100 zones and the 20/80 lines.
Bounce
Price touches 80 in a bearish context or 20 in a bullish one, and a mild candle reaction appears. Enter on the next candle in the trend direction.
Exit from the zone
%K crosses the 80 line top-down (or 20 bottom-up) and settles back inside the channel — enter on the next candle.
Expiration
Start with 1 candle on OTC; on calm pairs you can test 2 candles. If candles are stretched, go back to one.
Risk management
Fix your stake size. Avoid a series of consecutive entries on the same asset if %K/%D are whipsawing along a level.
FAQ
The levels are tied to a rolling High/Low window. Increase the HL Period or switch Placement to centered — the guides will become more stable.
The lines are off by default. Turn Show %K/%D on and set contrasting colors, or temporarily reduce zone opacity.
Lower Overall opacity or disable OB/OS zones, leaving only the 20/80 lines — timing remains readable.
Increase the HL Period, add confirmation by %D, and use a direction filter from the EMA ribbon or Flip Strike.
Sloped Levels Indicator — automatic construction
Draws sloped support and resistance from fresh pivots, supports simple and “strong” lines, extends them to the current price, and marks breakouts with a dashed style
Adaptive Regression Channel — an adaptive regression channel with a neat forecast
A flexible price channel on polynomial regression that adapts the window to volatility, keeps edges based on standard deviation, and softly extends ranges forward via a short Fourier forecast. The center recolors only on an actual price crossover — no chatter. A great tool for catching channel touches, inflections, and breakouts from consolidations in Spectra Charts.