Adaptive Regression Channel — an adaptive regression channel with a neat forecast
Theory
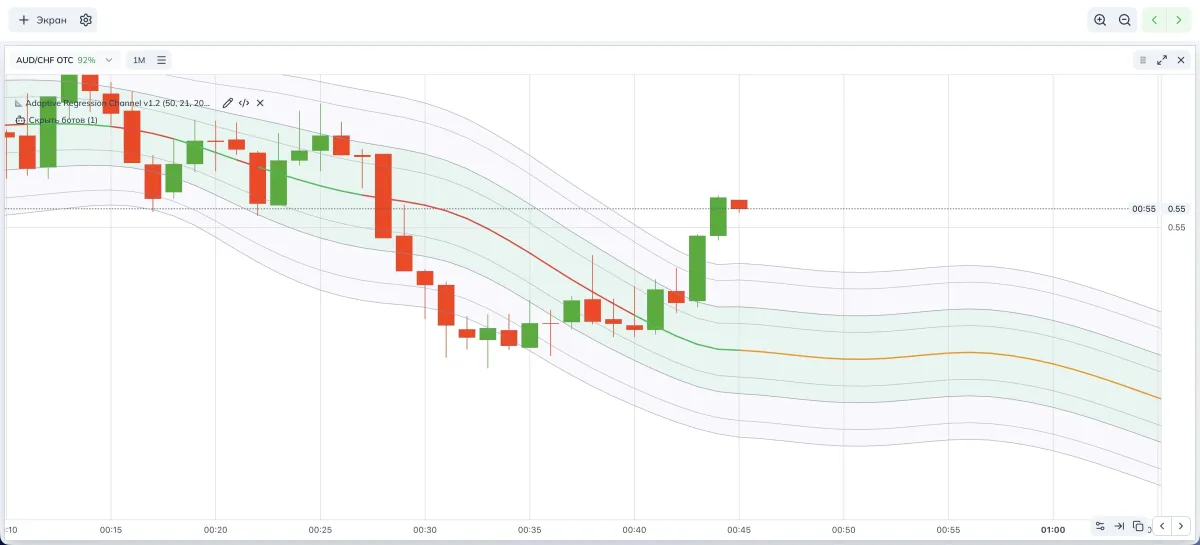
- The idea is simple: take a local price segment, build a regression line/curve, and draw standard-deviation lines around it — that’s your “working corridor.”
- To make the channel move with the market, the window length adapts to volatility: when the market is noisy — widen the window; when calm — shrink it.
- The center line recolors only when price truly crosses to the other side (anti-chatter by bars), and we carefully extend the center and outer bands forward using a small Fourier forecast — in fact it’s not “guessing,” it’s a smooth extrapolation of the local rhythm; still, it’s important to understand that the future movement cannot be predicted 100:.
- Additionally you can enable Fibonacci levels tied to the channel width.
How it works
- Polynomial regression (linear or quadratic) builds the channel center.
- A standard-deviation corridor forms inner/outer bounds for touches and overshoots.
- The adaptive window reacts to current volatility via ATR.
- Center recolor triggers only on a factual price cross through the center.
- A Fourier forecast smoothly extends the center and bounds forward, keeping a readable rhythm.
- Fibonacci lines scale from the standard corridor — handy for building your own strategies.
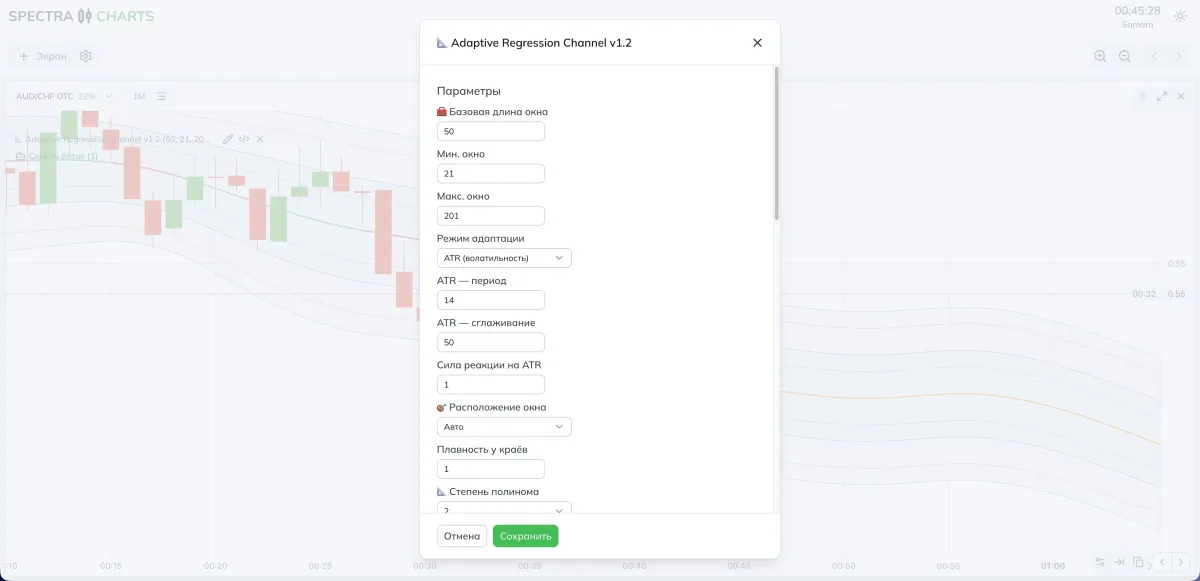
Interface screenshots
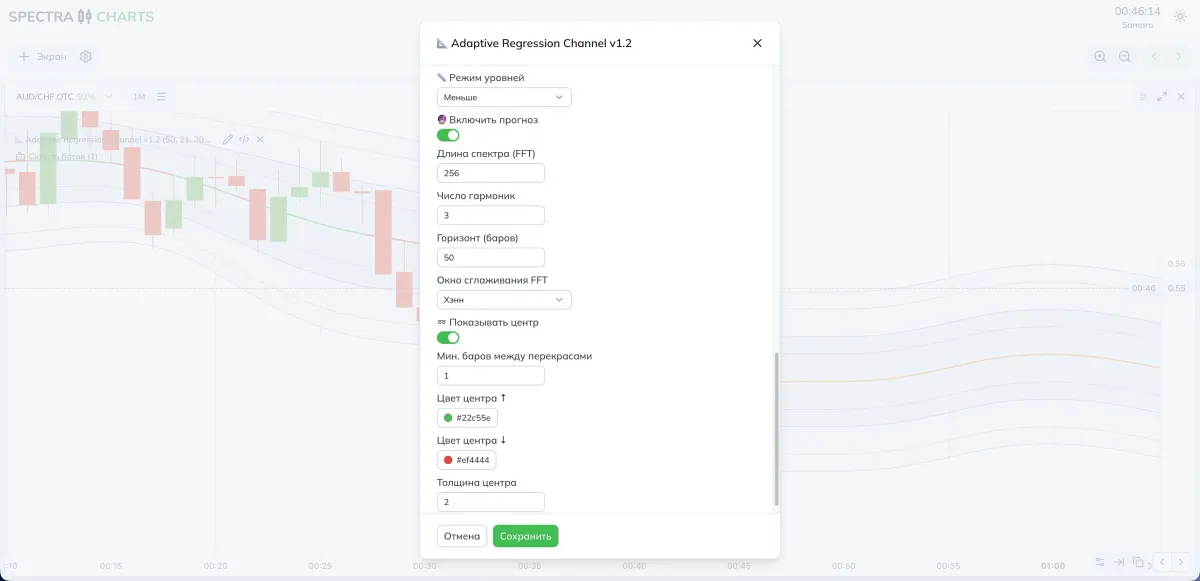
Parameters and impact
Window / adaptation
| Parameter | What it does | Lower | Higher |
|---|---|---|---|
| Base window length | Starting point for adaptation | Faster reaction, more noise | Smoother center, later signal |
| Min/Max window | Corridor within which the length “breathes” | Closer to price | More stable in trend |
| Adaptation mode | ATR-adaptive or fixed length | Fixed — steadier | ATR — livelier to market |
| ATR — period | Volatility sensitivity | Sharper shifts | Smoother, more inert |
| ATR — smoothing | Calms volatility metrics | More “clicks” | Smoother, fewer false trips |
| Reaction strength (γ) | How much length depends on ATR | Aggressive breathing | Makes the channel conservative |
Alignment
| Parameter | What it does | Suited for |
|---|---|---|
| Window placement | Auto/centered/trailing | In trend — trailing; for history analysis — centered |
| Edge smoothing | Blends estimates near window borders | Soft joint without jumps |
Regression shape
| Parameter | What it does | When to use |
|---|---|---|
| Polynomial degree | Line (1) or parabola (2) | Trend — linear; local bends — quadratic |
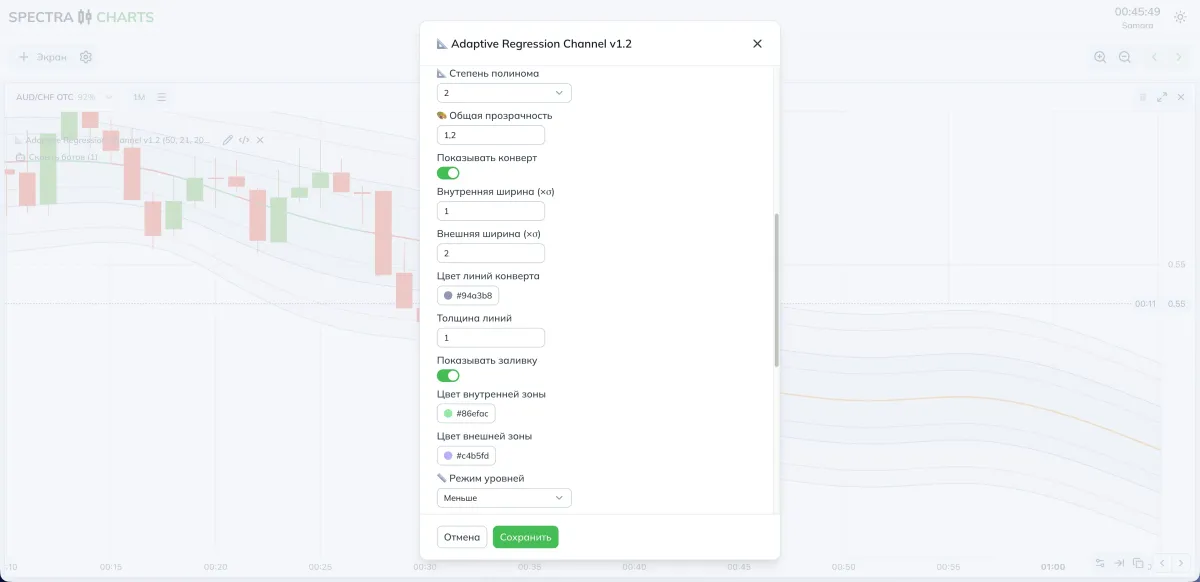
Styling
| Parameter | What it does | Note |
|---|---|---|
| Overall opacity | Unified intensity of lines/fills | Keep candles readable |
| Show envelope | Inner/outer σ lines | Basis of the visual analysis |
| Inner/outer width | σ multipliers for two belts | Inner — touches; outer — extremes |
| Line thickness/colors | Border visibility | Contrast with chart theme |
| Show fill | Soft zones between top/bottom | Helps “see” the range |
| Zone colors | Colors of inner/outer bands | Use opacity for saturation |
Fibonacci levels
| Parameter | What it does | Impact |
|---|---|---|
| Levels mode | Basic/extended/off | Bands built from σ — handy for targets/alerts |
Fourier forecast
| Parameter | What it does | Impact |
|---|---|---|
| Enable forecast | Extend center/channel forward | Plan take-profits/retests |
| Spectrum length | How much history to analyze | Less — faster reaction; more — steadier |
| Number of harmonics | How many dominants to take | Too many = overfitting |
| Horizon | Extension length | Near-term tactics vs longer plans |
| Windowing | Hann/rectangular | Hann smooths spectral “ringing” |
Center line
| Parameter | What it does | Impact |
|---|---|---|
| Show center | Draw the regression axis | Basis for recolor and touch logic |
| Min bars between recolors | Anti-chatter | Locks only a sustained side change |
| Center colors/thickness | Trend visibility | Keep contrast yet unobtrusive |
Practical presets
- Alignment — trailing: the center “looks forward.”
- Polynomial — linear: no excessive curvature.
- Inner belt — working touches; outer — overshoots/targets.
- Fourier forecast enabled for a gentle route extension.
- Alignment — centered: more symmetric levels.
- Polynomial — quadratic: captures waves better.
- Fibo mode basic: convenient targets inside the range.
- Higher zone transparency — focus on candles.
Combinations
- Flip Core: enter on Flip with follow-ups; use the channel for market context. Center recolor + inner-band touch = a strong setup.
- Stoch Levels Overlay: confirm with 20/80 timing — channel edge bounces behave cleaner.
- Trend Signals: trade in the channel’s direction; filter out touches against it.
Basic entry rules
Context
Center green/red + where price sits inside/at the channel edge.
Trigger
Touch of the inner/outer band or exit from it.
Confirmation
Candle impulse/pattern; use stoch/EMA ribbon if needed.
Plan
If forecast is on, use extended edges/Fibo for targets.
Risk
Don’t “chase” a touch if the candle already ran — wait for a retest.
FAQ
It’s a sliding-window regression: when the window shifts, recomputation is inevitable. For history analysis, enable centered placement — the curve is steadier.
σ is taken relative to the regression center, not a simple average. This gives more “geometric” edges in trends and slanted ranges.
The forecast is drawn as a separate line forward depending on current market context and tries to compute a potential price path. You should not rely blindly on this forecast.
Stoch Levels Overlay — classic stochastic oscillator over the chart
Overlays stochastic 0/20/80/100 levels directly on candles: soft overbought/oversold zones, guide lines, and an optional %K/%D projection. Convenient for catching reversals at channel edges and disciplining entries with Spectra Charts.
Indicator Imbalance Suite — FVG, OG, and VI
Price imbalance zones: Fair Value Gap, inter-candle gaps, and void imbalances. How zones are constructed, which filters are applied, how to control width via Points/%/ATR, parameter recommendations, and a working plan.