Indicator Imbalance Suite — FVG, OG, and VI
What is Imbalance Suite
Imbalance Suite is a visual tool that marks price imbalance zones on the chart. The suite includes three zone types:
- FVG (Fair Value Gap) — a “fair value gap” in a three-candle structure
- OG — an inter-candle gap between adjacent bars with no overlap
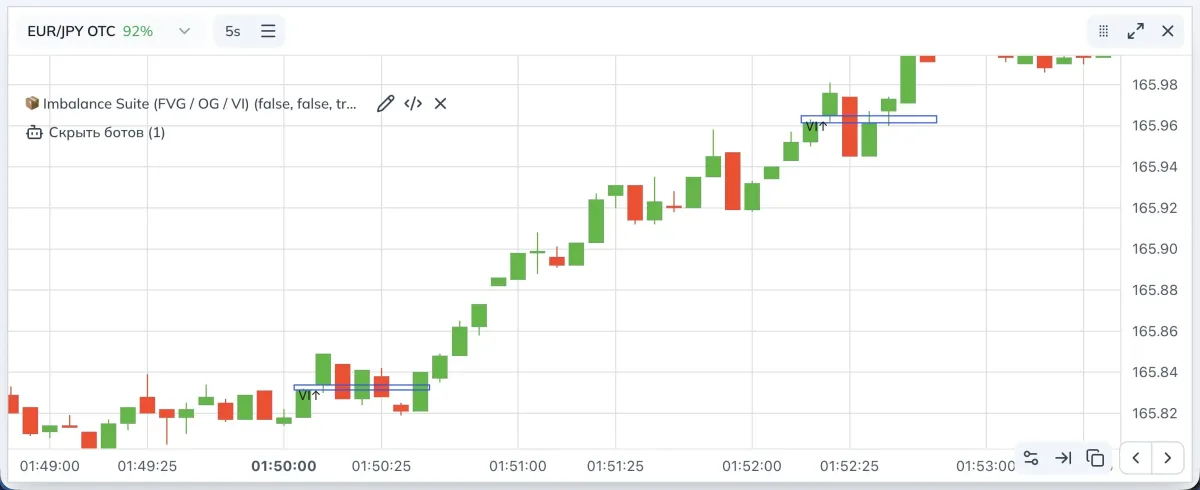
- VI — a void imbalance inside two neighboring bars where the bodies create a “void” in price
- FVG: in the bullish case, the low of the current candle is above the high of the candle two bars back; in the bearish case, the high of the current candle is below the low of the candle two bars back. This is a three-candle imbalance.
- OG: a classic inter-candle gap. A bullish gap — the current low is above the previous high. A bearish gap — the current high is below the previous low.
- VI: a “void” between the bodies of neighboring candles. For the bullish variant, the top of the zone is
min(open, close)of the current candle, the bottom ismax(open, close)of the previous one. For the bearish variant it’s the opposite.
Definitions and examples
FVG: in the bullish case, the low of the current candle is above the high of the candle two bars back; in the bearish case, the high of the current candle is below the low of the candle two bars back. This is a three-candle imbalance.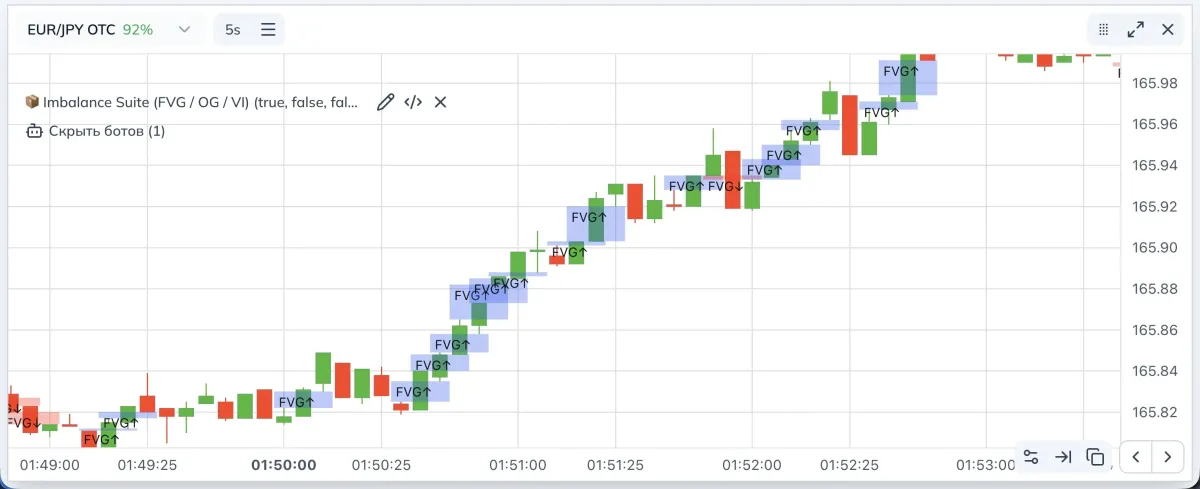
VI: a “void” between the bodies of neighboring candles. For the bullish variant, the top of the zone is min(open, close) of the current candle, the bottom is max(open, close) of the previous one. For the bearish variant it’s the opposite.
OG: a classic inter-candle gap. A bullish gap — the current low is above the previous high. A bearish gap — the current high is below the previous low.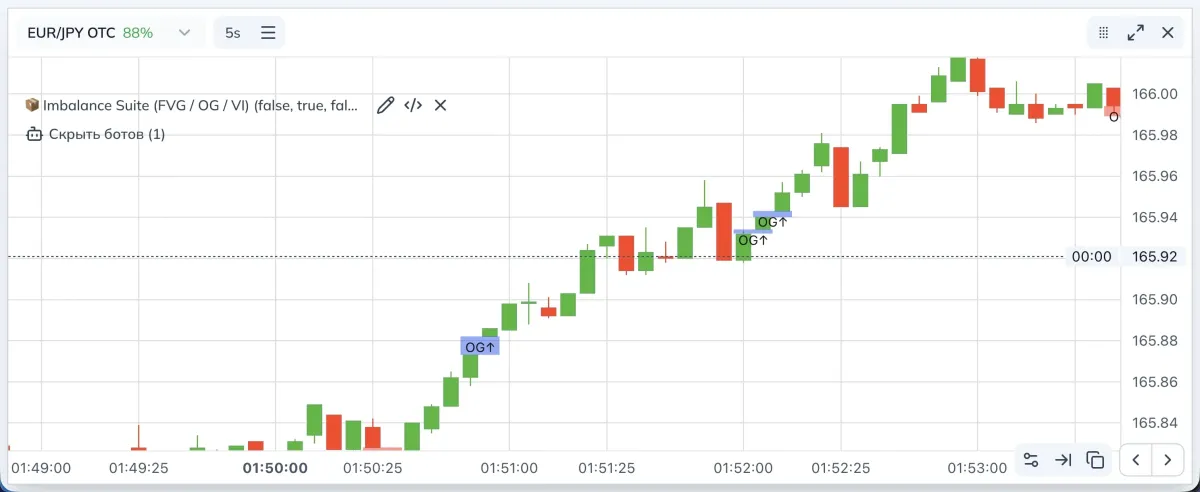
How the indicator works
Zones are drawn on top of candles with a primitive that renders fills and borders in media-space coordinates. Each zone has left and right time bounds, lower and upper price bounds, and an optional label.
Detection logic
OG
- Bullish:
low > high[1] - Bearish:
high < low[1]
The zone is anchored to the previous candle and can be extended to the right by a set number of bars.
VI
- Bullish: a set of conditions among the current
open/closeand the previousopen/close/high/lowforming a “body” gap - Bearish: mirrored
Drawn with a border; thickness is configurable.
FVG
- Bullish:
low > high[2]andclose[1] > high[2] - Bearish:
high < low[2]andclose[1] < low[2]
An important nuance: an FVG is ignored if a corresponding OG is found on the current or previous bar. This reduces zone duplication.
Width filter
- For each type you can enable a filter and choose a method:
Points — width > the specified value in points
% — width relative to the lower bound in percent
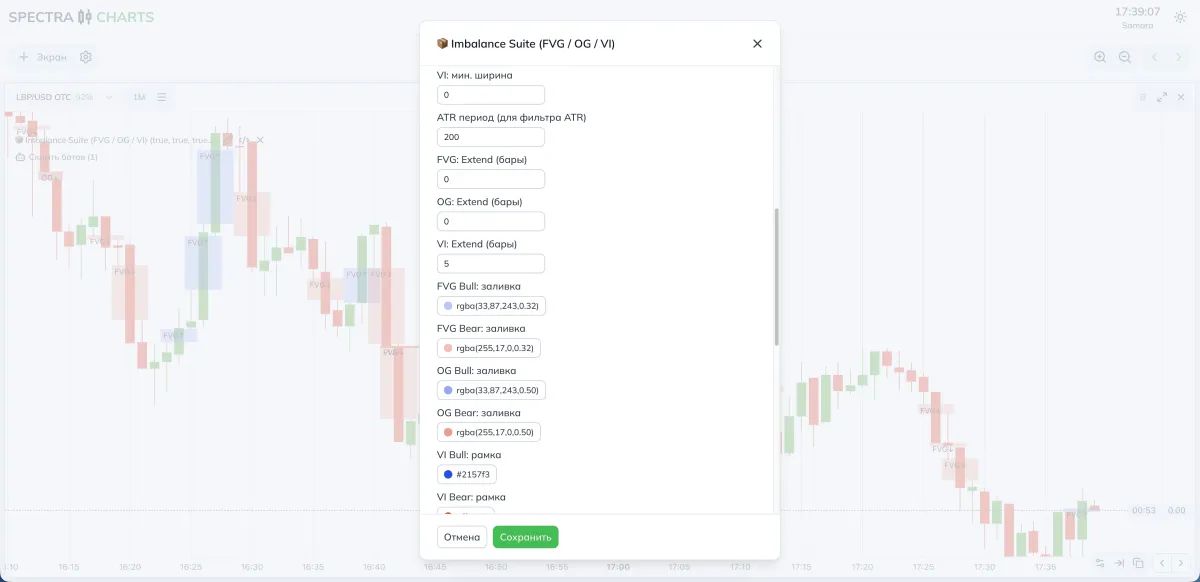
ATR — width greater thanATR × multiplier - ATR period sets the base for the ATR method.
Extend
- For FVG, OG, and VI you can set how many bars the zone is extended to the right. This helps see area relevance on later retests.
Appearance and labels
- FVG and OG are drawn as fills, VI as a border.
- Colors for bullish and bearish zones are set separately.
- Labels
FVG↑/FVG↓,OG↑/OG↓,VI↑/VI↓can be turned on or hidden.
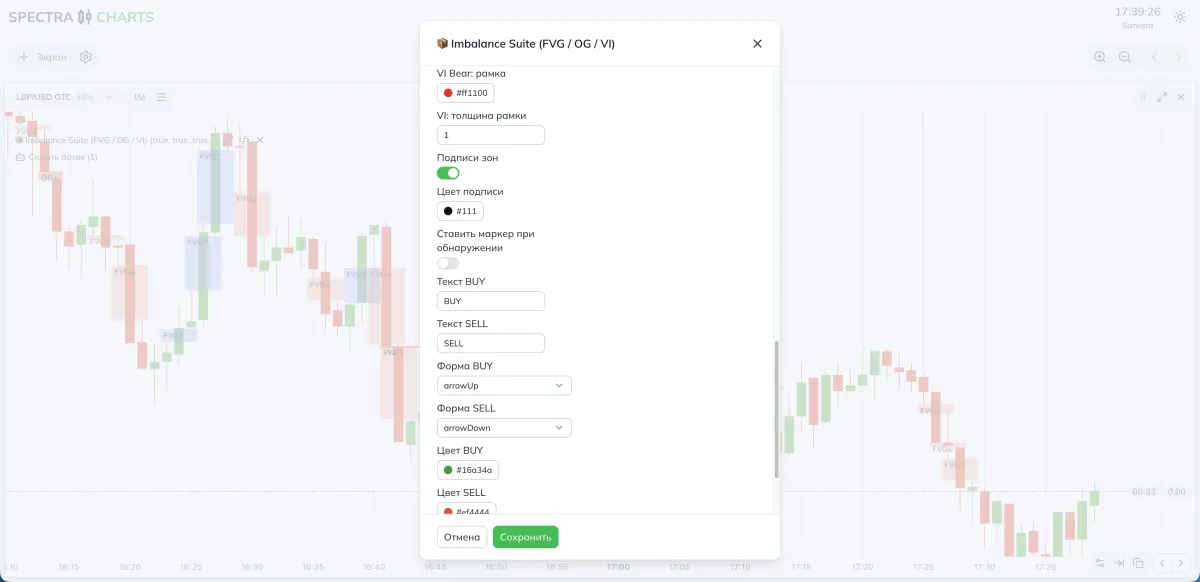
Detection markers
- Optionally you can place a marker at the moment a zone appears. This is not a trading signal per se. It’s a pointer fixing the fact of detection.
Indicator parameters (visual)
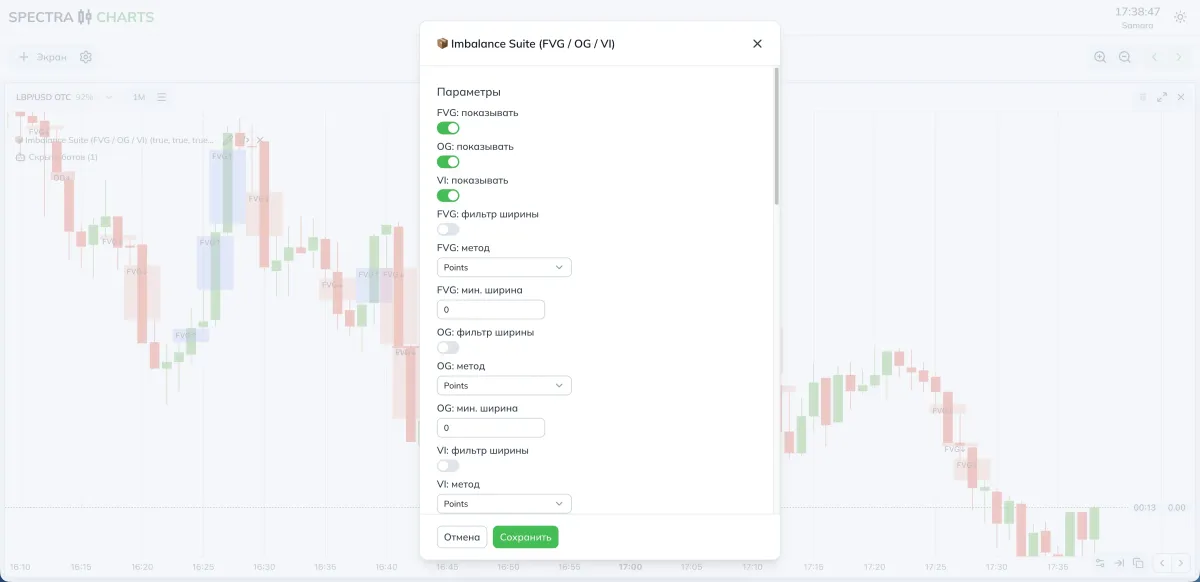
Parameters and impact
Enabling blocks
| Parameter | Purpose | Effect |
|---|---|---|
| FVG: show | Toggle FVG | Controls three-candle gaps |
| OG: show | Toggle OG | Inter-candle gap zones |
| VI: show | Toggle VI | Void imbalances with a border |
Width filter
| Parameter | Purpose | If you decrease | If you increase |
|---|---|---|---|
| FVG: width filter | Enables width check | — | — |
| FVG: method | Points, %, ATR | — | — |
| FVG: min width | Cut-off threshold for small FVGs | More zones | Fewer, but more pronounced |
| OG: width filter | Same for OG | — | — |
| OG: method | Points, %, ATR | — | — |
| OG: min width | Threshold for OG | More zones | Fewer, but cleaner |
| VI: width filter | Same for VI | — | — |
| VI: method | Points, %, ATR | — | — |
| VI: min width | Threshold for VI | More zones | Fewer, but cleaner |
| ATR period | Base for the ATR method | Reacts faster | More stable filter |
Extend
| Parameter | What it does | Use case |
|---|---|---|
| FVG: Extend (bars) | Extends the zone to the right | Handy for retests |
| OG: Extend (bars) | Extends the zone to the right | Shows when a gap is still “alive” |
| VI: Extend (bars) | Extends the zone to the right | Works as a reaction guide |
Appearance
| Parameter | What it does |
|---|---|
| FVG Bull/Bear: fill | Fill colors for FVG by direction |
| OG Bull/Bear: fill | Fill colors for OG |
| VI Bull/Bear: border | VI border color by direction |
| VI: border thickness | VI outline thickness |
Labels and markers
| Parameter | What it does |
|---|---|
| Zone labels | Toggle text labels inside the rectangle |
| Label color | Text color for labels |
| Place marker on detection | Show an arrow and text when a zone appears |
| BUY/SELL shape | Marker shape on detection |
| BUY/SELL text | Arrow captions |
| BUY/SELL color | Color of arrows and text |
Fewer but more expressive — raise the minimum width, choose the ATR method with a moderate period, and increase Extend only for truly strong areas.
Parameter recommendations
- FVG/OG/VI: enabled
- Width method: Points for FVG and OG, ATR for VI
- Width thresholds: FVG and OG — moderate values in points; VI —
0.5–1.0of ATR - Extend: FVG 0–2 bars, OG 0–2 bars, VI 3–5 bars
- Labels: enabled to get into the mechanics faster
- Width method: more often ATR for all three types
- Width thresholds: higher to cut noise around news
- Extend: keep moderate. Oversized tails make the chart hard to read
- Detection markers: situational. If there are many zones, you can disable markers
Where to view zones in Spectra Charts
- Open an asset on Pocket Option in Spectra Charts
- Connect Imbalance Suite
- In the panel, enable the needed blocks and set the width method
- Watch FVG, OG, and VI form right on top of candles
Trading plan
BUY
Work with bullish zones. Consider entries on a retest of the upper boundary of a bullish FVG/OG/VI and the appearance of a confirming candle in the impulse direction.
SELL
Work with bearish zones. Consider entries on a retest of the lower boundary of a bearish FVG/OG/VI with confirmation by a down candle.
Expiration
One candle. Then test two and three candles on your stats to tune the mode to the asset and time.
Risk
Fixed trade size. No martingale during the tuning phase. Keep a consistent approach to selecting zones and confirmations.
FAQ
Raise the minimum width. For volatile periods, use the ATR method and increase the threshold.
Reduce Extend for the corresponding zone type. Leave a tail only where you expect a retest.
The logic has an exclusion: FVG is skipped if a nearby OG is detected. This reduces duplication and chart overload.
Summary
Imbalance Suite helps see and fix imbalances of different nature. Control frequency and expressiveness of areas via width methods and Extend, enable labels while learning, and switch to stricter ATR filtering as you master the mechanics. This makes zones clear landmarks for retests and continuation scenarios.
Adaptive Regression Channel — an adaptive regression channel with a neat forecast
A flexible price channel on polynomial regression that adapts the window to volatility, keeps edges based on standard deviation, and softly extends ranges forward via a short Fourier forecast. The center recolors only on an actual price crossover — no chatter. A great tool for catching channel touches, inflections, and breakouts from consolidations in Spectra Charts.
Indicator Liquidity Sweep — sweeps from clustered levels
Clusters of swing levels, live support/resistance lines, SWEEP markers on price overshoot and return. Tolerance settings via ATR or %, presets for OTC and the real market, working plan.