Spectra Charts — overview of the platform and all its features
Overview of the Spectra Charts tool and all its features
What is Spectra Charts and what is it for
Spectra Charts is a modern platform for technical analysis and working with bots and indicators for binary options. The tool is built for convenient day-to-day trading: you configure screens, connect the indicators and bots you need, manage them from a single window, use bulk actions, and quickly test ideas.
Overview of Spectra Charts
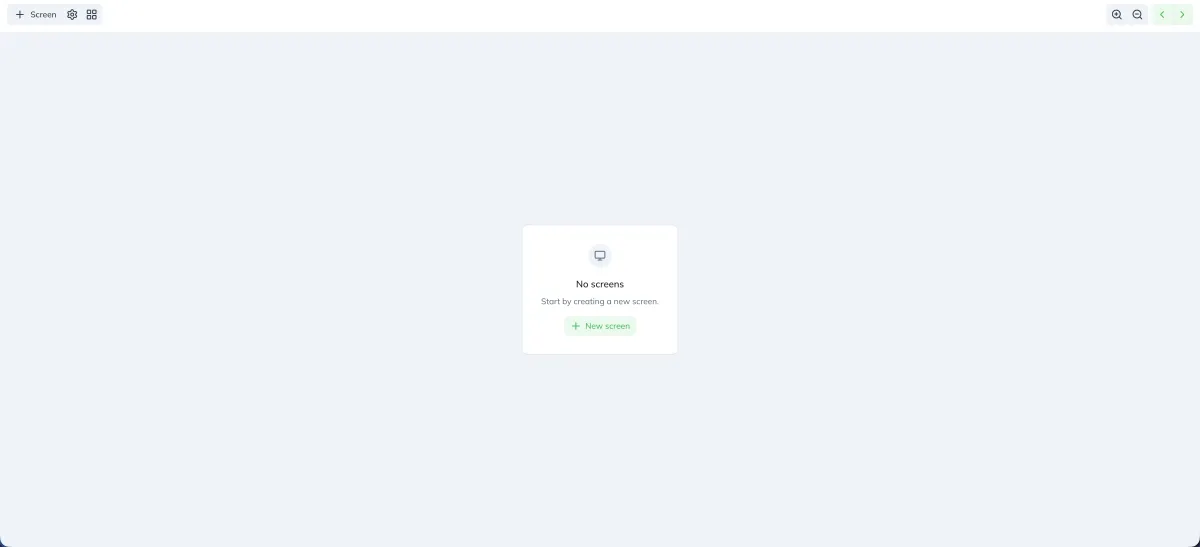
On the main page of the service, you see the basic set of features that every trader sees when opening the tool for the first time.
At the top left, there are buttons:
- Screen
- Settings
- Multi-charts
What is “Screen”?
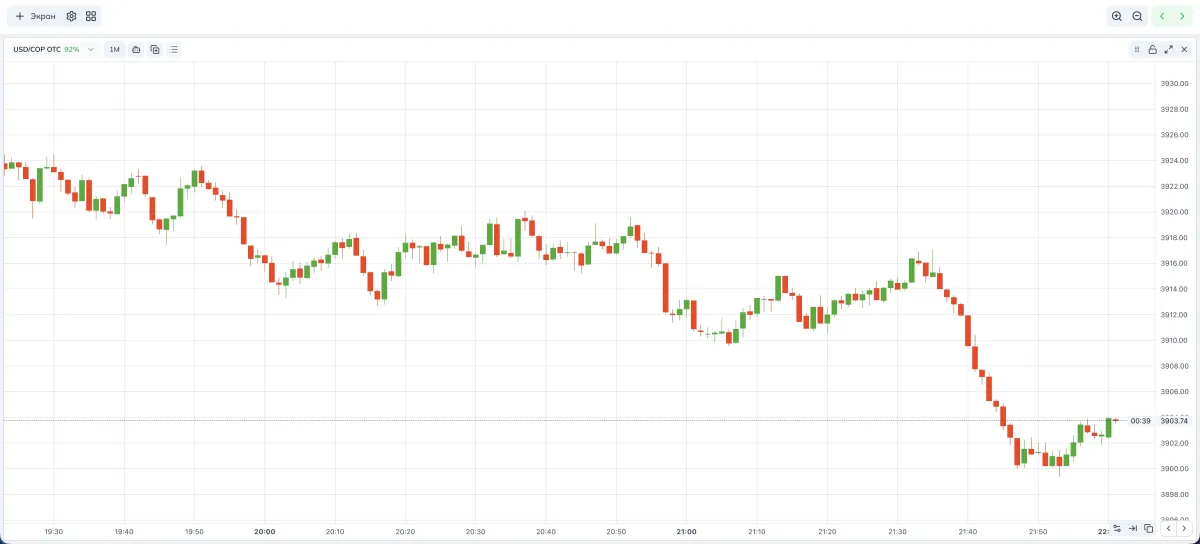
An example of displaying 1 screen. 1 screen = 1 chart.
These are visual screens for technical analysis of selected assets. You can add from 1 to 9 charts to your monitor. Each chart can be configured individually or, if needed, synced with others so that changes apply to several screens at once.
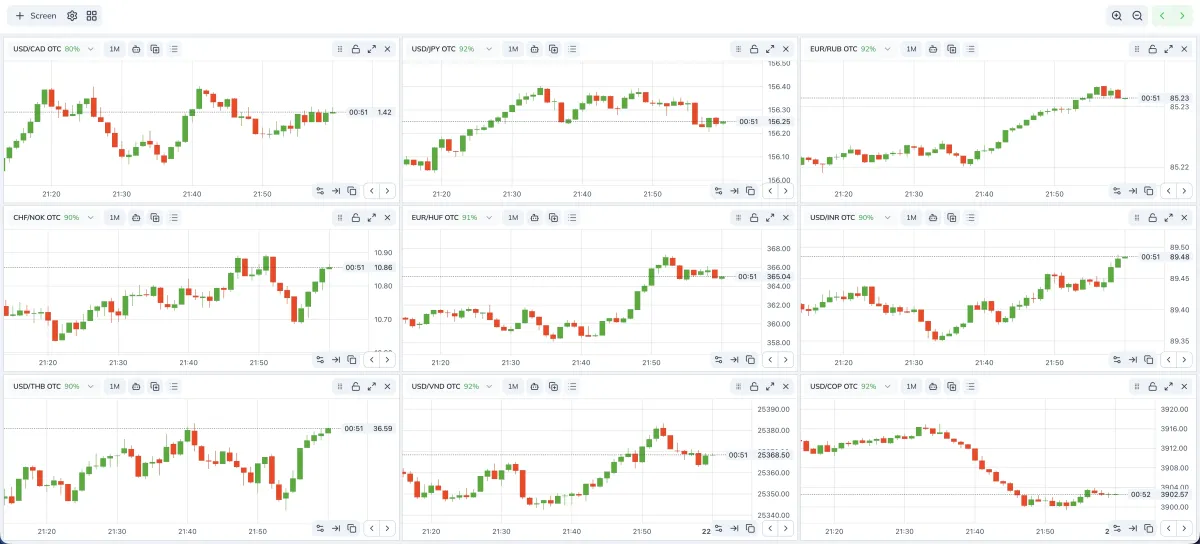
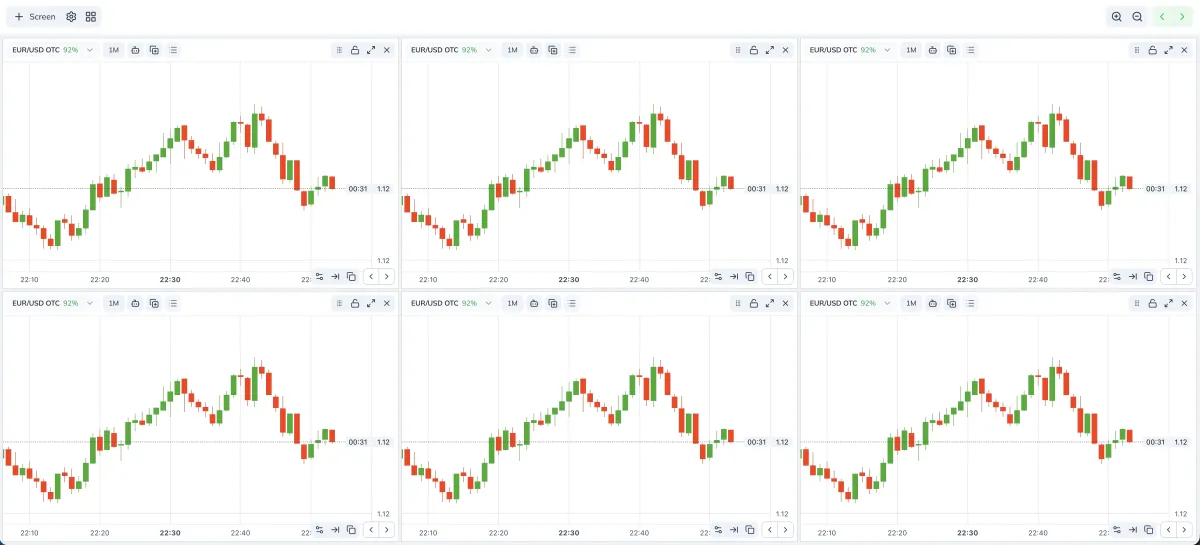
An example of displaying 9 screens. 9 screens = 9 charts.
What is “Settings”?
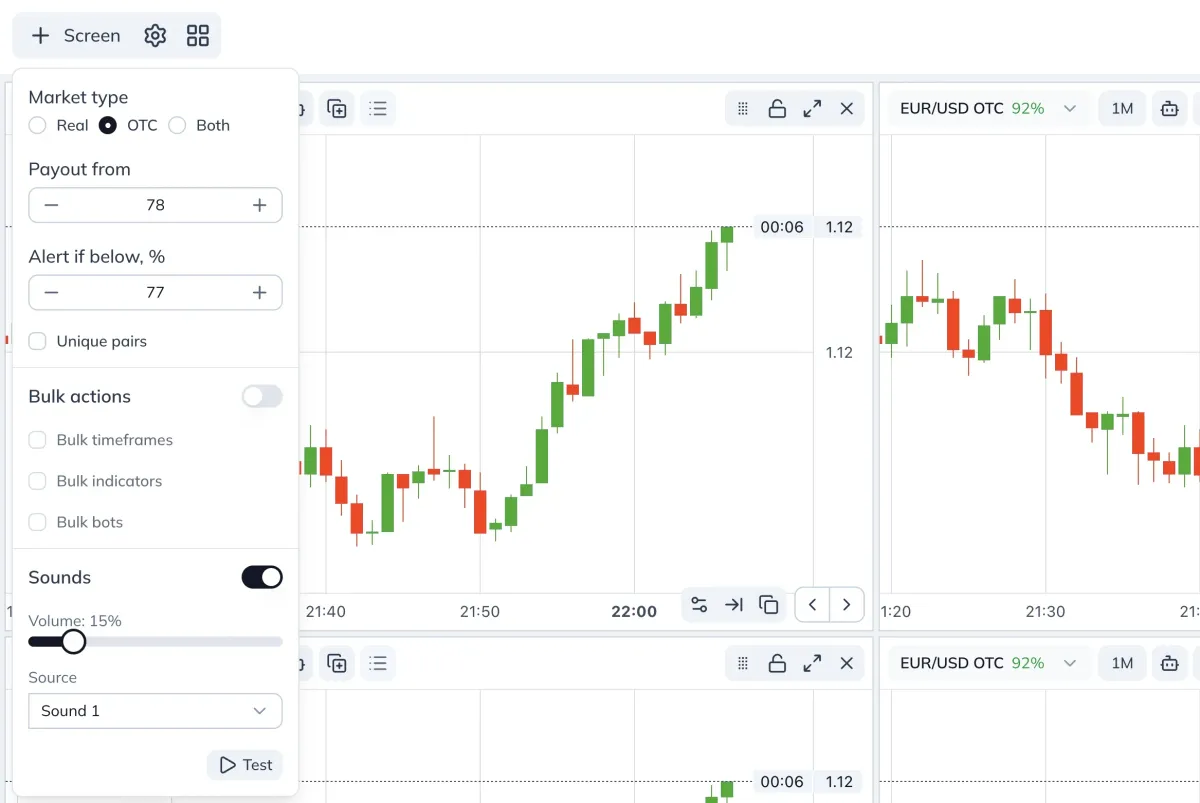
Settings affect the behavior of the assets opened on each chart:
- Market type
- Real — only exchange-traded Forex assets are shown
- OTC — over-the-counter assets with Pocket Option quotes
- Both — a mix of the two types, the most profitable assets from different sources are opened
- Payout from, % — minimum payout. Assets with a lower percentage will not be opened so you only work with the most profitable ones.
- Alert below, % — pop-up notification if payout drops below the selected threshold.
- Unique pairs — when enabled, each screen will have unique assets with no duplicates. When disabled, the same asset can appear on several screens.
- Bulk actions — enables applying changes on all screens at once:
- Bulk timeframes — changing the timeframe on one asset changes the timeframes on all of them.
- Bulk indicators — adding or editing an indicator is duplicated across all screens.
- Bulk bots — adding or editing a bot is duplicated across all screens.
- Sounds — sound notification about new signals at the moment they appear on the chart
(works only with bots that have built-in BUY/SELL signals). - Source — choose one of the available notification sounds.
- Test — checks how the sound is played in your browser.
Additional settings when bulk actions are enabled
In the top-right corner you’ll see:
- Bulk zoom for all screens: zoom in and out.
- Bulk asset switching on all screens: switch backward and forward.
Choosing the multi-chart mode
You can choose one of three chart display modes:
- Classic mode — up to 9 screens are visible at the same time for visual analysis of each asset.
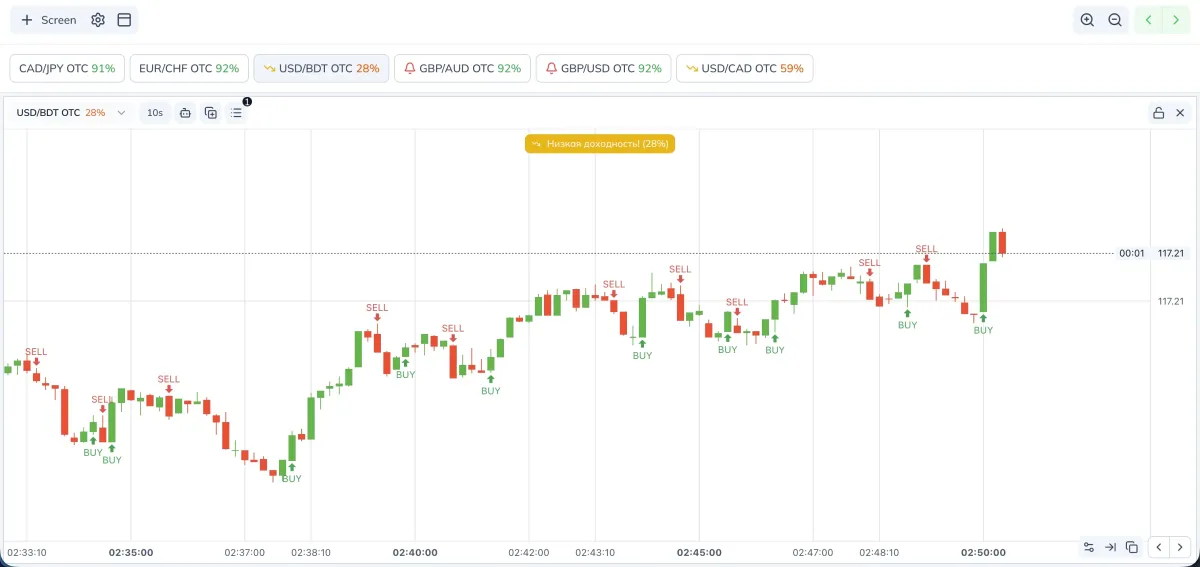
- Bottom asset selection panel — one main screen is open, the rest are collapsed and show a compact summary:
- payout for open assets,
- sharp payout drops,
- notifications about new signals from signal bots.
- Top asset selection panel — similar to the previous mode: one main screen, the rest are collapsed and display:
- payout for open assets,
- sharp payout drops,
- notifications about new signals from signal bots.
What each screen can do: control panel
Each screen has its own panel. If bulk actions are disabled, you can edit screens one by one, independently from each other.
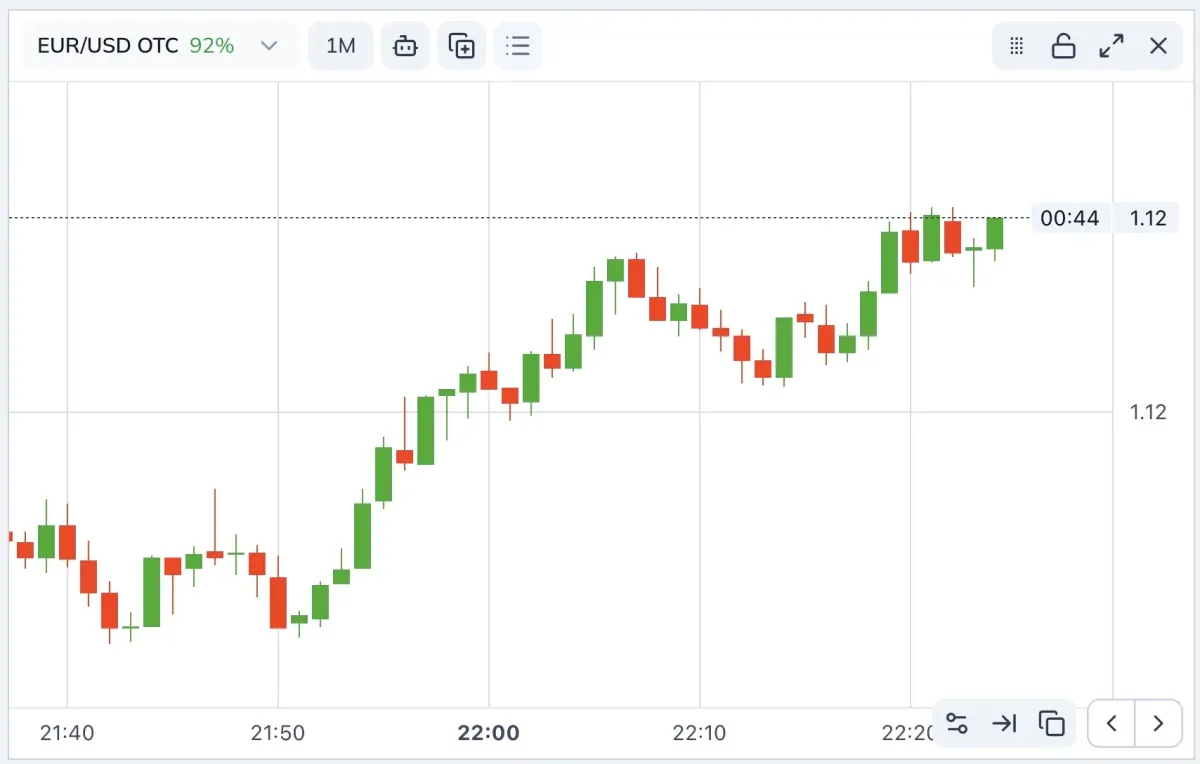
Below is the functionality from the top left, then the top right, then the bottom right corner:
- Select the asset to work with, for example: EUR/USD OTC.
- Select the timeframe, for example: 1M (1 minute).
- Tools menu — details below.
- Plus icon — quickly copy tools from one screen to the selected one.
- Three horizontal lines — manage open tools: hide, edit parameters, edit code (where available), delete.
- Drag screen — change the positions of screens by dragging them.
- Lock — locks the screen so the asset doesn’t change when bulk actions are enabled.
- Full screen — expands the selected chart.
- Close screen — deletes the current screen.
- Screen parameters — market type, payout threshold, alert threshold, auto-copy.
The “Tools” menu: what’s inside
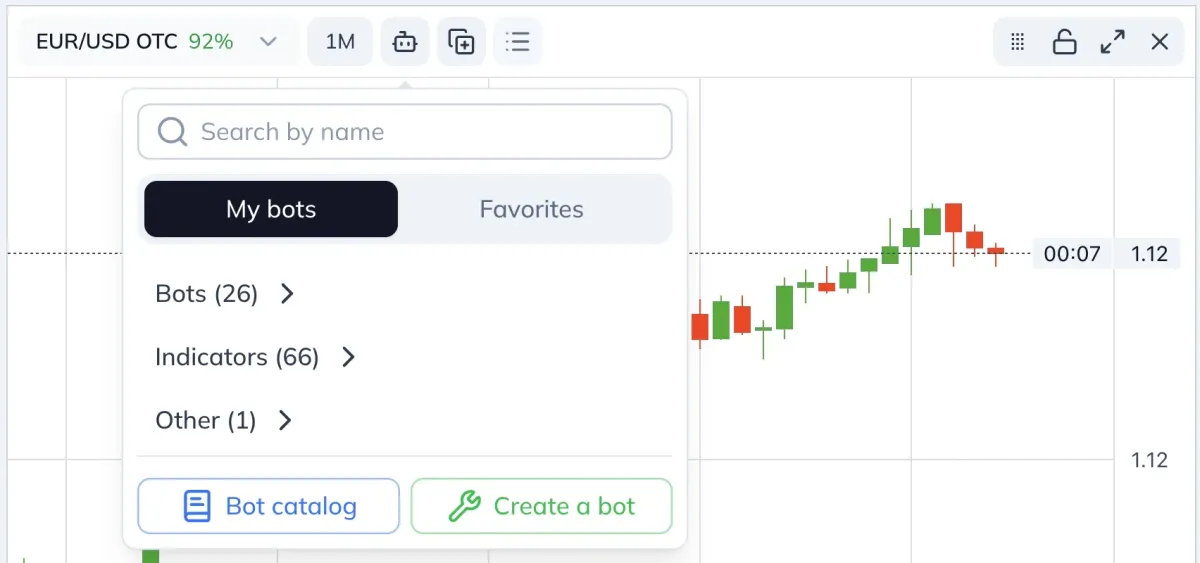
- Search — finds a bot or indicator by name among your tools or favorites. Start typing the first letters, and matches will appear in the lists below.
- Bots — all bots you’ve created in the builder.
- Indicators — all indicators you’ve created in the builder.
- Other — tools you created and placed in the “other” category.
- Favorites — tools from the public catalog that you’ve added to favorites.
- Bots catalog — public catalog with tools approved by the service.
- Create bot — built-in code editor for creating your own bots and visual indicators.
What is the bots catalog
The bots catalog is a list of public and hidden tools on the PoSignals platform.
In the catalog, you can choose any bot or indicator available to partners and approved by the admins. You can also work with hidden partner tools if you know the exact name. Just enter it in the search, and you’ll see the results.
How to add a bot or indicator to the chart
Step 1 — add the tool to Favorites
Open the catalog and choose a tool, then click “Add to favorites”.
After adding, the button will change to “Remove”. Clicking it removes the tool from Favorites.
Step 2 — apply the tool to the chart
Go to Favorites and select the added tool.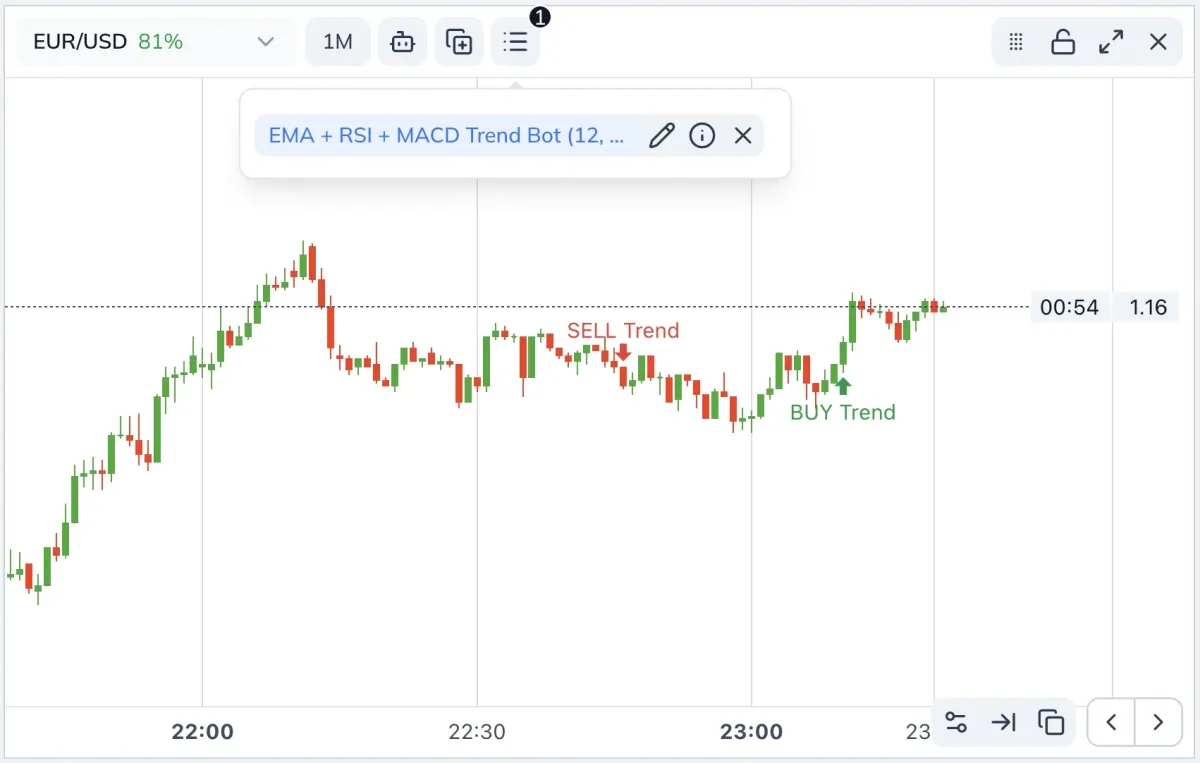
After selection, the tool will appear on the chart.
Managing tools on the chart
Next to each open tool, there are three buttons:
- Pencil — change the tool parameters to get more or fewer signals. In visual indicators, you can adjust line thickness and color.
- “i” icon — view the code (if it’s not hidden by the author), remove from favorites. For your own tools, you can also edit the code here.
- X icon — remove the tool from the chart.
Summary
In this post, we’ve finished the overview of the key functionality of Spectra Charts. In the next posts, we’ll go through how to create your own signal bots, as well as visual indicators and oscillators using our Bot Builder. This way you’ll be able to assemble a working toolkit for your strategy, test ideas, and improve your trading discipline without extra actions.
Bot Builder in Spectra Charts — what it is and how to get started
Step-by-step guide to the Bot Builder in Spectra Charts: why bots are needed, what strategies you can build on candle data without volumes, which AI model to choose, and how to prepare.
Flip Core — a smart signal bot for binary options
Finds the moment of a trend or a trend change, giving clear best entry points. Clean BUY/SELL, clean statistics, concise analytics — everything for discipline on short timeframes in Spectra Charts.